WEEK FIVE
TOPIC: PRESENTATION OF DATA
- Cumulative Frequency Table.
- Cumulative Frequency Curve.
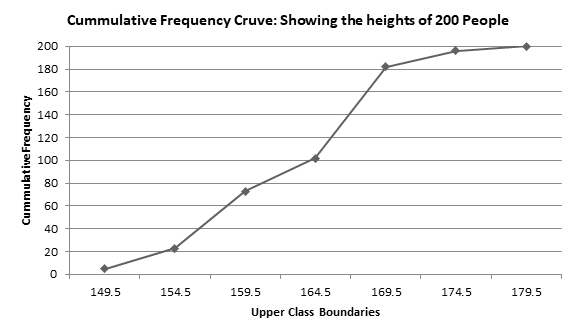
Cumulative Frequency Curve
The cumulative frequency curve is also called the OGIVE. It is the graph of the cumulative frequency against the upper class boundary.
Example
The table below shows the height of 200 people who were randomly picked.
| Heights(cm) | 145 – 149 | 150 – 154 | 155 – 159 | 160 – 164 | 165 – 169 | 170 – 174 | 175 – 179 |
| Frequency | 5 | 18 | 50 | 29 | 80 | 14 | 4 |
Construct for the distribution above, a cumulative frequency curve.
Solution:
| Heights | Frequency | Cumulative Frequency | Upper Class Boundary |
| 145 – 149 | 5 | 5 | < 149.5 |
| 150 – 154 | 18 | 23 | < 154.5 |
| 155 – 159 | 50 | 73 | < 159.5 |
| 160 – 164 | 29 | 102 | < 164.5 |
| 165 – 169 | 80 | 182 | < 169.5 |
| 170 – 174 | 14 | 196 | < 174.5 |
| 175 – 179 | 4 | 200 | < 179.5 |
 EVALUATION
The table shows the masses of a various quantities of maize sold by a farmer during the year 1985.
| Mass (kg) | 40 – 43 | 44 – 47 | 48 – 51 | 52 – 55 | 56 – 59 | 60 – 63 | 64 -67 | 68 – 71 |
| Frequency | 7 | 18 | 32 | 48 | 41 | 28 | 17 | 19 |
- Draw a cumulative frequency table. (b) Using a scale of 2cm to 4 kg on the x – axis and 2cm to 20units on the y – axis, draw the cumulative frequency curve.
GENERAL EVALUATION
Given the frequency distribution below. Draw a histogram and a cumulative frequency curve.
| Height (cm) | 160 – 164 | 165 – 169 | 170 – 174 | 175 – 179 | 180 – 184 | 185 – 189 | 190 – 194 |
| Frequency | 10 | 25 | 40 | 56 | 44 | 20 | 5 |
READING ASSIGNMENT
New General Mathematics SSS2, page164, exercise 14b.
WEEKEND ASSIGNMENT
The following table shows the distribution of the masses of 120 logs of wood, correct to the nearest kg.
| Masses (kg) | 15 – 24 | 25 – 34 | 35 – 44 | 45 – 54 | 55 – 64 |
| Frequency | 14 | 54 | 24 | 26 | 2 |
1. Draw a histogram for the distribution.
2. Make a cumulative frequency table for the distribution.
3. Draw a cumulative frequency curve for the distribution.
4. Use the graph to find the a. semi-interquartile range.b. 60th percentile.
WEEK SIX
REVIEW OF THE FIRST HALF TERM WORK AND PERIODIC TEST