WEEK 10
STATISTICS: AVERAGE, MEAN, MEDIAN AND MODE
Average is a single value used to represent a set of numbers (i.e all value in as et data)
The most common ly used statistics is average.
MEAN = SUM OF THE VALUE/NUMBER OF VALUE
MEDIAN = THE NUMBER AT THE MIDDLE AFTER THE ARRANGEMENT OF THE DATA IN INCREASING OR DECREASING ORDER
MODE= THE VALUE THAT OCCURS MOST FREQUENTLY.
EXAMPLES: Calculate the mean, media and mode of the following data
- 45, 50, 55, 54, 48, 53, 50, 55
- 38, 35, 36, 30.8, 34.7, 37.9, 33.1
- 3, 0,4,7, 0, 5, 3, 4, 0, 3, 6, 5, 5 ,4, 6, 5
Solution: MEAN= i.e the addition of all the given items, divided by the number of items
Mean = 45+50+ 55+ 54+ 48+ 53+ 50+ 55
8
= 410/8
= 51.25
Median = 45, 48, 50, 50, 53, 54, 55, 55
50 + 53
2
= 52
Mode = Bimodal which are 50 and 55
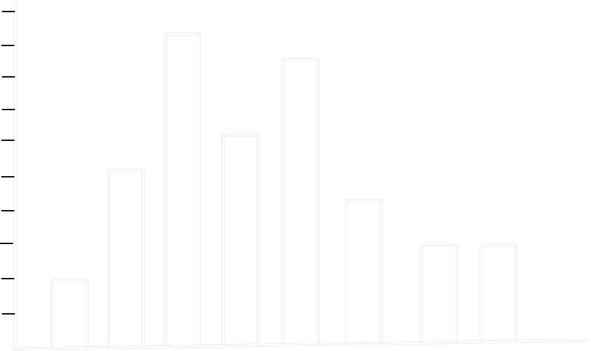
FREQUENCY TABLE: The figure below represents the number of children per family in a sample of 40 house in a street.
1,2,4,3,5,38,3,2,2,3,4,5,6
5,4,2,1,3,2,4,5,3,8,7,6,5,4
5,7,6,3,8,6,3,5,7,5,4,3
- Prepare a frequency table to represent the information.
- Draw a bar chart to represent the information
| NO OF CHILDREN PER FAMILY | FREQUENCY |
| 1 | 2 |
| 2 | 5 |
| 3 | 9 |
| 4 | 6 |
| 5 | 8 |
| 6 | 4 |
| 7 | 3 |
| 8 | 3 |
A BAR CHART SHOWING THE NO OF CHILDREN PER FAMILY IN A SAMPLE OF 40 HOUSES
Frequency
 10
10
9
8
7
6
5
4
3
2
1
0
1 2 3 4 5 6 7 8 no of children per family
Do these
Exercise 24.1 pg 263 No (2, 4, 5,& 6)
Exercise 24.3 pg 266 No (3 & 4)
Assignment
Exercise 25.1 pg 270 No (1, 2, 3, 4, & 5)