
DATA PROCESSING
 FIRST TERM SCHEME OF WORK FOR SS TWO
| weeks | Content |
| 1 | REVISION |
| 2 | DATA MODELS |
| 3 | DATA MODELING –TYPES OF MODELS |
| 4 | DATA MODELING- CREATING TABLES,FORM,QUERIES AND REPORTS (PRACTICAL) |
| 5 | DATA MODELING-SIGNIFICANCE OF DATA MODEL |
| 6 | DATA MODELING–EXAMPLES OF STANDARD MODELS |
| 7 | NORMAL FORMS –NORMALIZATION AND CLASSES |
| 8 | NORMAL FORMS – CONCEPT OF PRIMARY AND FOREIGN KEY |
| 9 | NORMAL FORMS – DETERMINANTS |
| 10 | ENTITY RELATIONSHIP MODELS |
| 11 | REVISION |
| 12 | EXAMINATION |
![]()


Definition
A data model is a conceptual representation of the data structures that are required by a database. The data structures include the data objects, the associations between data objects, and the rules which govern operations on the objects. As the name implies, the data model focuses on what data is required and how it should be organized rather than what operations will be performed on the data. To use a common analogy, the data model is equivalent to an architect’s building plans.

Concept of Data Modeling
- The concept of data modeling can be better understood if we compare the development cycle of a data model to the construction of a house. For example Company ABC is planning to build a guest house (database) and it calls the building architect (data modeler) and projects its building requirements (business requirements). Building architect (data modeler) develops the plan (data model) and gives it to company ABC. Finally company ABC calls civil engineers (DBA) to construct the guest house (database).

- Data Engineers, Data Modeler and Data Architect are the common titles for those who are involved in data modeling. To become an efficient data modeler, you should have an overview about the database objects, constraints, normalization and understanding the requirements correctly.
- A data model can be thought of as a diagram or flowchat that illustrates the relationships between data.
- Data modelers often use different approaches to data modeling: it includes: Conceptual Data Modeling: identifies the highest-level relationships between different entities. Enterprise Data Modeling : similar to condeptual data modeling,but addresses the unique requirements of a specific business. Logical Data Modeling :- illustrates the specific entoities ,attributes and relationships involved in a business function.serves as the basis for the creation of the physical data model. Physical Data Modeling :- represents an application and database-specific implementation of a logical data model.
- Database design is defined as: “design the
- logical and physical structure of one or more
- databases to accommodate the information
- needs of the users in an organization for a defined set of applications”. The design process roughly follows five steps:
- 1. planning and analysis
- 2. conceptual design
- 3. logical design
- 4. physical design
- 5. implementation
 Components of A Data Model
- An entity-relationship diagram which represents the data structures in a pictorial form. Because the diagram is easily learned, it is valuable tool to communicate the model to the end-user. The second component is a data document. This a document that describes in detail the data objects, relationships, and rules required bythe database. The dictionary provides the detail required by the database developer to construct the physical database.
![]()

Conceptual Data Model
- A conceptual data model is a summary-level data model that is most often used on strategic data projects. It typically describes an entire enterprise. Due to its highly abstract nature, it may be referred to as a conceptual model.
 Common characteristics of a conceptual data model:
- Enterprise-wide coverage of the business concepts. Think Customer, Product, Store, Location, Asset.
- Designed and developed primarily for a business audience Entities will have definitions.
- Designed and developed to be independent of DBMS, data storage locations or technologies. In fact, it would address digital and non-digital concepts. This means it would model paper records and artifacts as well as database artifacts.

Logical Data Model
- A logical data model is a fully-attributed data model that is independent of DBMS, technology, data storage or organizational constraints. It typically describes data requirements from the business point of view.

- Typically describes data requirements for a single project or major subject area.
- Contains relationships between entities that address

•Entities and attributes will have definitions.cardinality and nullability (optionality) of the
relationships.
- Designed and developed to be independent of DBMS, data storage locations or technologies. In fact, it may address digital and non-digital concepts.
- Entities and attributes will have definitions.

A logical data model will normally be derived from and or linked back to objects in a conceptual data model.

Physical Data Model
- A physical data model is a fully-attributed data model that is dependent upon a specific version of a data persistence technology. The target implementation technology may be a relational DBMS, an XML document, a SQL data storage component, a spreadsheet or any other data implementation option.
- Typically describes data requirements for a single project or application. Sometimes even a portion of an application.
- Typically contains 10-1000 tables, although these numbers are highly variable depending on the scope of the data model.
- Contains relationships between tables that address cardinality and nullability (optionality) of the relationships.
- Designed and developed to be dependent on a specific version of a DBMS, data storage location or technology.
- Columns will have datatypes with precisions and lengths assigned.
- Tables and columns will have definitions.
- Will also include other physical objects such as views, primary key constraints, foreign key constraints, indexes, security roles, store procedures, XML extensions, file stores, etc.
![]()


How to Add a table
When you open a new, blank database, Access automatically creates an empty table. To customize that table, start defining your fields and add data.

Rename a table in a desktop database
- Table1 is the default name of the first table in a new desktop database. It’s a good idea to name the table something more meaningful.
- On the Quick Access Toolbar, select Save
- In the Table name box, enter a descriptive name.

Add a table to a desktop database
- Add more tables to a database, if you need them, even if you started with a template.
- On the Create tab, select Table.
Access adds a new table with the name Table<#>, where <#> is the next sequential, unused number.
- Rename the table using the procedure in Rename a table in a desktop database, earlier in this module.

Save a table
Before you close your database, to avoid losing the work you’ve done and the data you’ve entered, be sure to save your table. When you try to close the database, if you haven’t saved your work on a table, Access prompts you to save it. Or, at any time, select .

Add a field by entering data
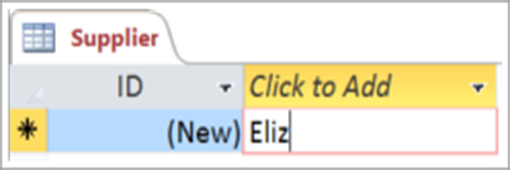
- In Datasheet view, enter data in the Click to Add column of the datasheet.
Access creates a new field.
 In the column heading, type a new name for the field.
 In the column heading, type a new name for the field.

Change the data type of a field
- When you add a field by typing data into it, Access sets the field’s data type based on its contents. View the data type on the Fields tab, under Data Type.
 To change the data type:
- Select the field.
- On the Fields tab, open the Data Type list and select a data type.

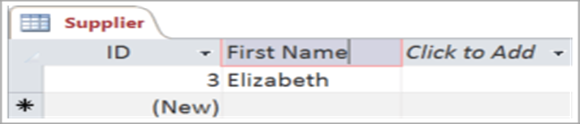
Add a field for a specific data type
- Access validates data as it’s entered to ensure that it matches the field’s data type. If you need a specific data format in a field, specify its data type when you create it.
- With the table open in Datasheet view, select Click to Add and then select a data type
 What are queries?
- In Access, queries are like questions that you ask to find related, even very specific, information in your database.
- In Access, a query is a database object. It doesn’t store data. Instead, it displays data that is stored in tables and it makes that data available for you to work with. A query might show data from one or more tables, from other queries, or from a combination of the two.

Create a form
- You can use the Form tool to create a form with a single mouse-click. When you use this tool, all the fields from the underlying data source are placed on the form. You can start using the new form immediately, or you can modify it in Layout view or Design view to better suit your needs.
 Use the Form tool to create a new form
- In the Navigation Pane, click the table or query that contains the data you want to see on your form.
- On the Create tab, in the Forms group, click Form.

Introduction to reports
- When you use a database, you typically use reports to view, format, and summarize data. For instance, you might create a list-type report to display phone numbers for all your contacts, or a summary report to total up the sales for your company across different regions and time periods.
![]()
- E/R modeling was revolutionary in that, for thefirst time in data processing, data – not processes – were at the center of both business analysis and system design. Data could now become a reusable commodity. That providedthe ability to track every person or programusing the unique data elements for anypurpose.
- At the same time, Dr. Edgar F. Codd, who in the 1970s was a researcher at IBM, realized that data could potentially also be physically organized and stored independent of any particular automated process, so that multiple processes could share the same data. In otherwords, he too wanted data to be reused for multiple purposes.
- Data models can facilitate interaction among the designer, the applications programmer,and the end user.
- A well-developed data model can even foster improved understanding of the organization for which the database design is developed.
- In short, data models are acommunication tool.
- Data model creates simple abstraction for better understanding of a complex real-world data environment.

STANDARD DATA MODELS
A standard data model or industry standard data model (ISDM) is a data model that is widely applied in some industry, and shared amongst competitors to some degree. They are often defined by standards bodies, database vendors or operating system vendors.
When in use, they enable easier and faster information sharing because heterogeneous organizations have a standard vocabulary and pre-negotiated semantics, format, and quality standards for exchanged data.
- The more effective standard models have developed in the banking, insurance, pharmaceutical and automotive industries, to reflect the stringent standards applied to customer information gathering, customer privacy, consumer safety, or just in time manufacturing.
The standard data models used are:- the popular relational model of database management, but some use the hierarchical model, especially those used in manufacturing or mandated by governments, e.g., the din codes specified by Germany.
- The most complex data models known are in military use, and consortia such as NATO tend to require strict standards of their members’
equipment and supply databases. However, since they did not share these with non-
NATO competitors, it could be referred to as a Standard model
Other standard are :-Common Education Data Standards
(CEDS),SIF
- An emerging area of standard data model is in
- the identity card arena, where a vast number
- of security engineering solutions for public
- spaces, e.g., airports, other public transport,
- hospitals, are expected soon to rely on a
- standard data model for identifying the card
- holder/user of the facility. This may contain
- biometric information or other data that would
- be standardized across an entire trade bloc,
- e.g., the European Union or the North
- American Free Trade Agreement (NAFTA).
 1st, 2nd, and 3rd
Normal Forms

Overview
Today we’ll talk about:
◦ Database Normalization
- Data Anomalies Caused by:
- Update, Insertion, Deletion
◦ Brief History/Overview
◦ 1st Normal Form
◦ 2nd Normal Form ◦ 3rd Normal Form
◦ Conclusion

Database Normalization
- The main goal of Database Normalization is to restructure the logical data model of a database to:
- Eliminate redundancy
- Organize data efficiently
- Reduce the potential for data anomalies.

Data Anomalies


- Data anomalies are inconsistencies in the data stored in a database as a result of an operation such as update, insertion, and/or deletion.
- Such inconsistencies may arise when have a particular record stored in multiple locations and not all of the copies are updated.
- We can prevent such anomalies by implementing 7 different level of normalization called Normal Forms (NF)
- We’ll only look at the first three. ☺

Brief History/Overview
- Database Normalization was first proposed by Edgar F. Codd.
- Codd defined the first three Normal Forms, which we’ll look into, of the 7 known Normal Forms.
- In order to do normalization we must know what the requirements are for each of the three Normal Forms that we’ll go over.
- One of the key requirements to remember is that Normal Forms are progressive. That is, in order to have 3rd NF we must have 2nd NF and in order to have 2nd NF we must have 1st NF.
1st Normal Form
 The Requirements
- The requirements to satisfy the 1st NF:
◦ Each table has a primary key: minimal set of attributes which can uniquely identify a record
◦ The values in each column of a table are atomic (No multivalue attributes allowed).
◦ There are no repeating groups: two columns do not store similar information in the same table.

 The Requirements
1st Normal Form Example
| 124 | 123B | Smith | 467 | 209-0 | 102-8 |
![]()
![]()
![]()
![]()
![]() Un-normalized Students table:
Un-normalized Students table:
![]()
![]() Normalized Students table:
Normalized Students table:
| 124 | 123B | Smith | 467 | 102-8 |
2nd Normal Form
 The Requirements
- The requirements to satisfy the 2nd NF:
◦ All requirements for 1st NF must be met.
◦ Redundant data across multiple rows of a table must be moved to a separate table.- The resulting tables must be related to each other by use of foreign key.
| 124 | 123B | Smith | 467 |
| 124 | 102-8 |

![]()
![]()
![]() 2nd Normal Form Example
2nd Normal Form Example
Students table
![]()
Registration table
3rd Normal Form
 The Requirements
- The requirements to satisfy the 3rd NF:
◦ All requirements for 2nd NF must be met.
◦ Eliminate fields that do not depend on the primary key;- That is, any field that is dependent not only on the primary key but also on another field must be moved to another table.

3rd Normal Form Example
| 124 | 123B | Smith | 467 |
![]()
![]()
![]()
![]() Students table:
Students table:
Student table: Advisor table:
3rd Normal Form
| 123B | Smith | 467 |

![]()
![]() Students table: Example Cont.
Students table: Example Cont.
Registration table: Advisor table:
|

Conclusion
We have seen how Database Normalization can decrease redundancy, increase efficiency and reduce anomalies by implementing three of seven different levels of normalization called Normal Forms. The first three NF’s are usually sufficient for most small to medium size applications.

KEYS

Primary Key: a minimal set of attributes that form a candidate key
Any attribute or collection of attributes that functionally determine all attributes in a record is a Candidate Key.
Note: since no two rows in a relational table can be duplicates, the entire record is always a candidate key.

Primary Key (C)
- C determines all attributes
- No subset of the attributes in C is a candidate key
A key consisting of more than one attribute is called a
“composite key.”

Good Primary Keys
- Do not change over the life of the database
- Are not “intelligent keys”
- Are not too long
- Do not consist of too many attributes (3 or fewer is good)

Foreign Keys
A value in the “child” table that matches with the related value in the “parent” table.
SalesRep(SalesRepNumber, Name)
[ 03 | Mary Jones ]
[ 124![]() | 03
| 03
]
Customer(CustomerNumber, SalesRepNumber)
![]()
 Entity/Relationship Modelling

In This Lecture
Entity/Relationship models
◦ Entities and Attributes
◦ Relationships
◦ Attributes
◦ E/R Diagrams

Database Design
- Before we look at how to create and use a database we’ll look at how to design one
- Need to consider
◦ What tables, keys, and constraints are needed?
◦ What is the database going to be used for? - Conceptual design
◦ Build a model independent of the choice of DBMS
- Logical design
◦ Create the database in a given DBMS
- Physical design
◦ How the database is stored in hardware

Entity/Relationship Modelling
- E/R Modelling is used for conceptual design
◦ Entities – objects or items of interest
◦ Attributes – facts about, or properties of, an entity
◦ Relationships – links between entities
- Example
◦ In a University database we might have entities for Students, Modules and Lecturers. Students might have attributes such as their ID, Name, and Course, and could have relationships with Modules (enrolment) and Lecturers (tutor/tutee)

Entity/Relationship Diagrams
- E/R Models are often represented as E/R diagrams that
◦ Give a conceptual view of the database
◦ Are independent of the choice of
DBMS
◦ Can identify some problems in a design


- Entities represent objects or things of interest
◦ Physical things like students, lecturers, employees, products
◦ More abstract things like modules, orders, courses, projects - Entities have
◦ A general type or class, such as
Lecturer or Module
◦ Instances of that particular type, such as Steve Mills, Natasha Alechina are instances of Lecturer
◦ Attributes (such as name, email address)

Diagramming Entities
- In an E/R Diagram, an entity is usually drawn as a box with rounded corners
- The box is labelled with the name of the class of objects represented by that entity


Attributes
- Attributes are facts, aspects, properties, or details about an entity
◦ Students have IDs, names, courses, addresses, …
◦ Modules have codes, titles, credit weights, levels, … - Attributes have
◦ A name
◦ An associated entity
◦ Domains of possible values
◦ Values from the domain for each instance of the entity they are belong to

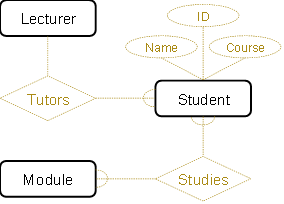
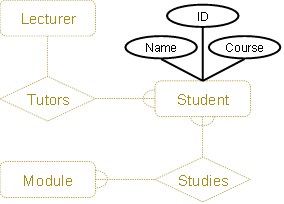
Diagramming Attributes
- In an E/R Diagram attributes may be drawn as ovals
- Each attribute is linked to its entity by a line
- The name of the attribute is written in the oval

Relationships
- Relationships are an association between two or more entities
◦ Each Student takes several Modules
◦ Each Module is taught by a Lecturer
◦ Each Employee works for a single
Department
- Relationships have
◦ A name
◦ A set of entities that participate in them
◦ A degree – the number of entities that participate (most have degree 2)
◦ A cardinality ratio

Cardinality Ratios
- Each entity in a relationship can participate in zero, one, or more than one instances of that relationship
- This leads to 3 types of relationship…
- One to one (1:1)
◦ Each lecturer has a unique office
- One to many (1:M)
◦ A lecturer may tutor many students, but each student has just one tutor
- Many to many (M:M)
◦ Each student takes several modules, and each module is taken by several students
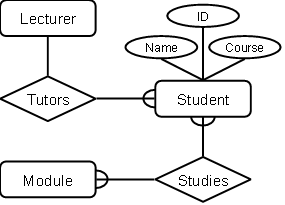
 Diagramming Relationships
- Relationships are links between two entities
- The name is given in a diamond box
- The ends of the link show cardinality
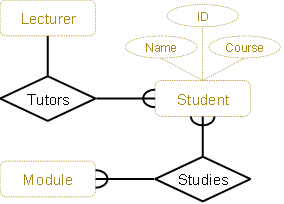
One ![]() Many
Many

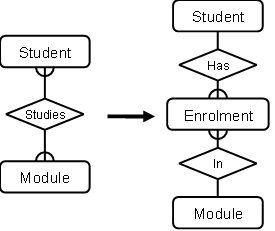
Removing M:M Relationships
- Many to many relationships are difficult to represent
- We can split a many to many relationship into two one to many relationships
- An entity represents the M:M relationship


Making E/R Models
- To make an E/R model you need to identify
◦ Enitities
◦ Attributes
◦ Relationships
◦ Cardinality ratios - from a description
- General guidelines
◦ Since entities are things or objects they are often nouns in the description
◦ Attributes are facts or properties, and so are often nouns also
◦ Verbs often describe relationships between entities

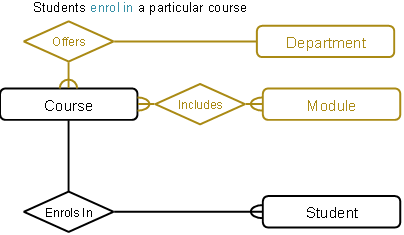
A university consists of a number of departments. Each department offers several courses. A number of modules make up each course. Students enrol in a particular course and take modules towards the completion of that course. Each module is taught by a lecturer from the appropriate department, and each lecturer tutors a group of students

Example – Entities
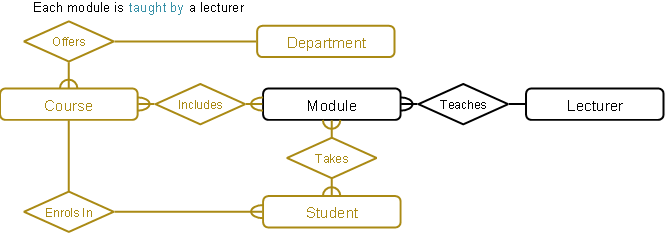
A university consists of a number of departments. Each department offers several courses. A number of modules make up each course. Students enrol in a particular course and take modules towards the completion of that course. Each module is taught by a lecturer from the appropriate department, and each lecturer tutors a group of students

Example – Relationships
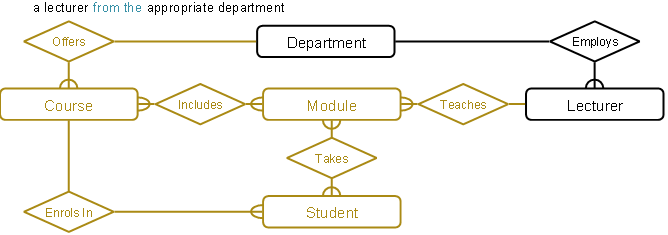
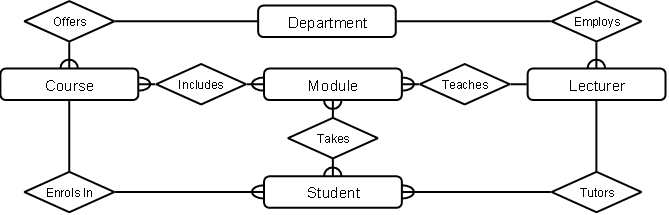
A university consists of a number of departments. Each department offers several courses. A number of modules make up each course. Students enrol in a particular course and take modules towards the completion of that course. Each module is taught by a lecturer from the appropriate department, and each lecturer tutors a group of students


![]()
![]()
![]() Example – E/R Diagram
Example – E/R Diagram
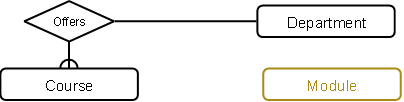
Entities: Department, Course, Module, Lecturer, Student

![]()
![]() Example – E/R Diagram
Example – E/R Diagram
Each department offers several courses

![]()
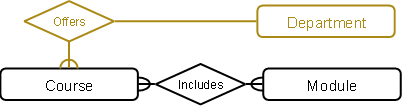
![]() Example – E/R Diagram
Example – E/R Diagram
A number of modules make up each courses

![]()
Example – E/R Diagram

![]()
Example – E/R Diagram


Example – E/R Diagram

Example – E/R Diagram

Example – E/R Diagram


 Example – E/R Diagram

Entities and Attributes
- Sometimes it is hard to tell if something should be an entity or an attribute
◦ They both represent objects or facts about the world
◦ They are both often represented by nouns in descriptions - General guidelines
◦ Entities can have attributes but attributes have no smaller parts
◦ Entities can have relationships between them, but an attribute belongs to a single entity

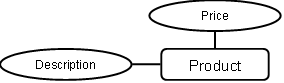
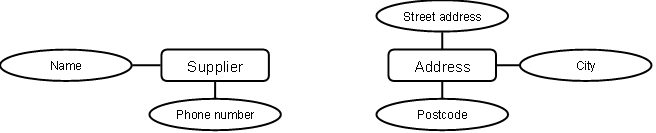
We want to represent information about products in a database. Each product has a description, a price and a supplier. Suppliers have addresses, phone numbers, and names. Each address is made up of a street address, a city, and a postcode.

Example – Entities/Attributes
- Entities or attributes:
- product
- description
- price
- supplier address
- phone number
- name
- street address
- city
- postcode
- Products, suppliers, and addresses all have smaller parts so we can make them entities
- The others have no smaller parts and belong to a single entity

Example – E/R Diagram

Example – Relationships
- Each product has a supplier
◦ Each product has a single supplier but there is nothing to stop a supplier supplying many products
◦ A many to one relationship - Each supplier has an address
◦ A supplier has a single address
◦ It does not seem sensible for two different suppliers to have the same address
◦ A one to one relationship
