
Share this:
Map Work
How do you draw and label sketch maps?
What is a sketch map?
When drawn, a sketch map allows a representation of a map (OS or other) to be included in an essay, investigation or project which can be used to show the particular features of an area. It is almost impossible to draw out an OS Map, there is just too much information, and it is unlikely that all of it needs to be shown. So the idea of a sketch map is to show only the features you need using coloured areas to highlight them.
The example below shows a representation of part of the Kingsbridge and Salcombe (Devon, UK) OS Map. This was used to highlight the reasons for siting a new town in a particular location on the map.
The structure of a sketch map


- TITLE – the essential first step. A title should explain what the sketch
map and labels are intending to show. - DRAWING THE SKETCHING AREA – in this example, the sketch map centred on the location of the new town and drew 3 grid squares X 3 grid squares (making a square on the paper roughly 9cm X 9cm). This may vary with different sketch maps. In this example, this size was chosen to show enough of the surrounding area so that site factors could be shown. Make sure the sketching area is situated in the middle of the paper so that labels can be written all around it.
- SKETCHING – this is the difficult part. Using the OS Map, select those features that are important to what is being shown and use a colour scheme to show those features. It does not have to be exact, just a representation.
- KEY – make sure that the scheme you used to draw the sketch map is represented in the key, so those who look at the map know what it is you are trying to represent.
- LABELLING – the rest of the space should be taken up with the most important part. Labels should be detailed and explain what it is you are trying to show. Only label those parts that are important and that are to do with the theme of the sketch map. If in doubt, look again at your title and decide whether your labels have anything to do with it! Look at the labels on the example sketch map, which looked at site factors / reasons for siting a new town to help.
How is height shown on maps?
Height can be shown on maps in three ways – contours. layer colouring and spot heights. This page attempts to show and explain what the symbols are on the map you can expect. With OS Maps, you are only likely to find spot heights and contour lines, not layer colouring.
- – Contour
Lines
Contour lines are lines on a map which show lines of equal height. They are usually orange or brown and show the height in metres on a break in the line.
The closer contour lines are together, the steeper the relief is. The space to put the numbers may be too little on an area that is steep, so the numbers may only be put on every other line. Usually, contours are drawn at 50 metre intervals.
- – Layer
Colouring

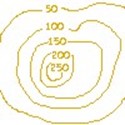
Layer colouring involves colouring the areas between contour lines a specific colour to represent a particular height. In this example, white represents below
50 metres, green is 50-100m, yellow is 100-150m and brown is 150m and above.
To fully understand what is being shown, the first diagram is an aerial view with a cross-section (X-Y) through it – this is shown in the second diagram as if looking at it from the side.
3 – Spot
Heights
Spot heights are an extremely simple way of showing height on a map.
Simply, they are a black spot with the height in metres printed next to it. The spot marks the exact place on the map that is at the height shown by the numbers (the numbers do not mark the place at that height).
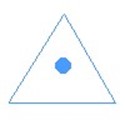
The second diagram shows a special kind of spot height, called a triangulation
pillar (a blue triangle with a blue spot in the middle). These are printed with a height at that point, and represent a point on the land where a height marker has been put on the land.
To test yourself on patterns shown on maps, go back to the sheet that you were
given near the start of the topic that shows the aerial and side views of different landforms.
Six Figure grid references:
- Read the number along the bottom first (along the corridor? And the number up the side second (up the stairs).
- This gives you a 4 fig grid references.
- Estimate how far along and how far up the feature is and put the 2 together.
- The 4 fig ref for the phone box is 2776. The 6 fig reference is 270752.


