Share this:
Representation of data Questions
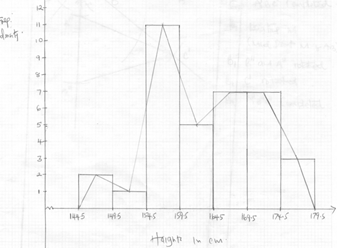
1. The height of 36 students in a class was recorded to the nearest centimeters as follows.
148 159 163 158 166 155 155 179 158 155 171 172 156 161 160 165 157 165 175 173 172 178 159 168 160 167 147 168 172 157 165 154 170 157 162 173
(a) Make a grouped table with 145.5 as lower class limit and class width of 5. (4mks)
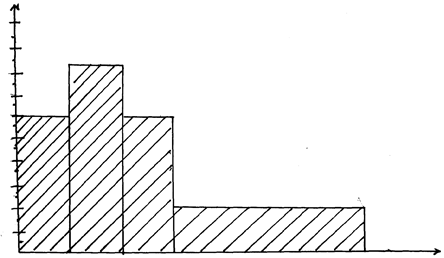
2. Below is a histogram, draw.
![]()
![]()
![]()
![]()
![]()
![]()
![]()
![]()
![]()
![]()
![]()
![]()
![]()
![]()
![]()
![]()
![]()
Use the histogram above to complete the frequency table below:
Length | Frequency |
11.5 ≤ x ≤13.5 13.5 ≤ x ≤15.5 15.5 ≤ x ≤ 17.5 17.5 ≤ x ≤23.5 |
3. Wambui spent her salary as follows:
Food | 40% |
Transport | 10% |
Education | 20% |
Clothing | 20% |
Rent | 10% |
Draw a pie chart to represent the above information
4. The examination marks in a mathematics test for 60 students were as follows;-
60 | 54 | 34 | 83 | 52 | 74 | 61 | 27 | 65 | 22 | |||
70 | 71 | 47 | 60 | 63 | 59 | 58 | 46 | 39 | 35 | |||
69 | 42 | 53 | 74 | 92 | 27 | 39 | 41 | 49 | 54 | |||
25 | 51 | 71 | 59 | 68 | 73 | 90 | 88 | 93 | 85 | |||
46 | 82 | 58 | 85 | 61 | 69 | 24 | 40 | 88 | 34 | |||
30 | 26 | 17 | 15 | 80 | 90 | 65 | 55 | 69 | 89 | |||
Class | Tally | Frequency | Upper class limit | |||||||||
10-29 30-39 40-69 70-74 75-89 90-99 | ||||||||||||
From the table;
(a) State the modal class
(b) On the grid provided , draw a histogram to represent the above information
5. The marks scored by 200 from 4 students of a school were recorded as in the table below.
Marks | 41 – 50 | 51 – 55 | 56 – 65 | 66 – 70 | 71 – 85 |
Frequency | 21 | 62 | 55 | 50 | 12 |
- On the graph paper provided, draw a histogram to represent this information.
- On the same diagram, construct a frequency polygon.
- Use your histogram to estimate the modal mark.
6. The diagram below shows a histogram representing the marks obtained in a certain test:-
(a) If the frequency of the first class is 20, prepare a frequency distribution table for the data
(b) State the modal class
(c) Estimate: (i) The mean mark (ii) The median mark
7. The data below shows the number of sessions different subjects are taught in a week.
Draw a pie chart to show the data:
Subject | Eng | Maths | Chemistry | C.R.E |
No. of sessions | 8 | 7 | 4 | 3 |
8. The height of 50 athletes in Moi University team were shown below:
Height (cm) | 150-159 | 160-169 | 170-179 | 180-189 | 190-199 | 200-209 |
Frequency | 2 | 9 | 12 | 16 | 7 | 4 |
i) State the modal class
ii) Calculate the median height of the athletes
9. The table below shows the length of 40 mango tree leaves;
Length (mm) | Frequency | Cumulative frequency |
118-126 127-135 136-144 145-153 154-162 163-171 172-180 | 3 4 10 12 5 4 2 | 3 7 17 29 34 38 40 |
(a) Determine the;
(i) Modal class
(ii) Median class
(b) Calculate; (i) the mean of the leaves (ii) the median of the leaves
Representation of data Answers
1. | (a)
|
B1 B1 B1 B1
B1 B1
B1 B1
B1
B1 |
Classes Tally mark column Freq. column Freq density column (can be implied) Freq. density (y axis Height (x axis) Correct spacing as per scale Histogram drawn (bars) Joining mid point of the bars Joining mid point of first class to 144.5 Joining mid point of last class to 179.5 | ||||||||||||||||||||||||||||||||
10 |
1.
Length 11.5 ≤ x≤ 13.5 13.5 ≤ x≤ 15.5 15.5 ≤ x≤ 17.5 17.5 ≤ x≤ 23.5 | Frequency 6 9 6 3 |
2. Food: 40/100 x 360 = 144 °
Transport: 10/100 x 360 = 36°
Education: 20/100 x 360 = 72 °
Clothing: 20/100 x 360 = 72 °
Rent: 10/100 x 360 = 36°
3. Class Tally Frequency Upper Limit
10 – 29 ∣∣∣∣
∣∣∣ 8 29.5 B2 for
30 – 39 ∣∣∣∣
∣ 6 39.5 all tally
40 – 69 ∣∣∣∣
∣∣∣∣
∣∣∣∣
∣∣∣∣
∣∣∣∣
∣∣∣ 28 69.5 B2 all
70 – 74 ∣∣∣∣
∣ 6 74.5 – frequency
75 – 89 ∣∣∣∣
∣∣∣ 8 89.5 – B1
90 – 99 ∣∣∣∣ 4 99.5 B1
Modal class 40 – 69 B1
![]()
![]()
![]()
![]()
![]()
![]()
4. See the graph paper.
For correct class boundaries
For correct class intervals.
All frequency densities
Correct scale
All the bars drawn.
Top mid pts. Of bars indicated.
For the mid pts. Joint to make a polygon.
For correctly identifying the modal mark point.
For reading correctly the modal mark ≡ 53.5 0.1
5. (a)
Marks | Frequency |
5-9 10-19 20-30 40-49 | 20 50 40 30 |
(b) Modal class is 10-19
(c)(i)
Class | x | f | fx | Cf |
5-9 | 7 | 20 | 140 | 20 |
10-19 | 14.5 | 50 | 725 | 70 |
20-39 | 29.5 | 40 | 1180 | 110 |
40-49 | 44.5 | 30 | 1335 | 140 |
F = 140 | Fx =3380 |
x = fx = 3380 = 24.14
f 140
(ii) Median mark is at 70 + 71 = 70.5th position
Median = 119.5 + (0.5) x 20
40
= 19.5 + 0.25
= 19.75
6. Total No. of sessions
= 8 + 7 + 4 + 3 = 22
Angle for:
English = 8/22 x 360 = 130.9°
Maths = 7/22 x 360 = 114.5°
Chemistry = 4/22 x 360 = 65.5°
CRE = 3/22 x 360 = 49.01°
7. 180 – 189
Class limits
class | limits | f | cf |
149.5 | 159.5 | 2 | 2 |
159.5 | 169.5 | 9 | 11 |
169.5 | 179.5 | 12 | 23 |
179.5 | 189.5 | 16 | 39 |
189.5 | 199.5 | 7 | 46 |
199.5 | 209.5 | 4 | 50 |
Median = 50/2 = 25
179.5 + 25 – 23 x 10
16
= 179.5 + 20 = 180.75
16
179.5 + 26 – 23 x 10
16
179.5 + 30 = 181.38
16
180.75 + 181.38
2
= 181.06
8. a) i) 145 – 153
ii) Median class
(40 + 1/2)th value median class = 145 – 153
This is the 20.5th value
The value also in the 145 – 153 class
b)
Class | x | f | fx |
118- 126 127- 135 136 – 144 145 – 153 154 – 162 163 – 171 172 – 180 | 122 131 140 B1 149 158 167 176 | 3 4 10 B2 12 5 4 2 | 366 524 1400 1788 790 668 352 |
Ef = 40 | Efx = 5888 |
B2 for all values of fx correct and B1 for 4 values of fx and above orrect
Mean = Efx = 5888 = 147.2mm
Ef 40
Median 20th = 144.5 + (11/12 x 9) = 152.75
21st = 144.5 + (12/12 x 9) = 153.5
Median = 152.75 + 153.5 = 153.125
2
(Alternatively one could work out the 20.5 value directly using median formula)