WEEK NINE
TOPIC : APPLICATION OF INTEGRATION II : SOLID REVOLUTION AND TRAPEZOIDAL RULE
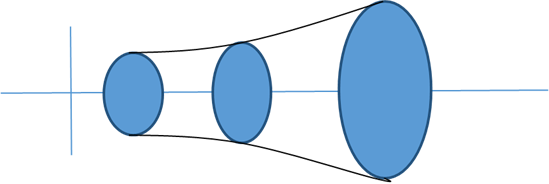
A solid whichb has a central axis of symmetry is a solid of revolution.Forexample, a cone, a cylinder , a vase etc.
y
Consider the area under a portion AB of the curve y = f(x) revolved about the x axis through four right angle or 3600, each point of the curve describes a circle centered on the x axis. A solid revolution can be thought of as created in this way with the circular plane ends cutting the x – axis at x = a and x = b.
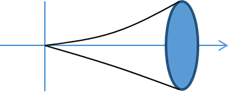
Let v be the volume of the solid for x = a up to an arbitrary value of x between a and b. Given abincreament dx in x , and y takes an increamentdy and v increases by dv.
![]()
![]()
The figure shows a section through the x axis, from this it is seen that the slice dv of bthickness dx is enclosed between two cylinders of outer radius y +dy and inner radius y .
Then ,πy2dx< dv < π (y + dy)2dx;
With appropriate modification, if the curve is falling at this point.
 π y2 < dv/dx < π (y + dy)2
![]()
![]()
![]() if dx 0, dy 0 as dv/dx dv/dx
if dx 0, dy 0 as dv/dx dv/dx
: . dv/dx = πy2 or V =
Where y = f(x) and v = volume of solid revolution of the curve where y = f(x) is rotation completely and x – axis between limits x = a and x =b.
Examples;The portion ofthe curve y = x2 between x = 0 and x = 2 is rotated complrtely around the x axis, find the volume of the solid generated?
V =
=
V =
V = =
Put x = 2 and x = 0 then substitute into the expression above
V =
THE TRAPEZOIDAL RULE
There are many definite integrals which can’t be evaluated and thus required advance techniques e.g
etc
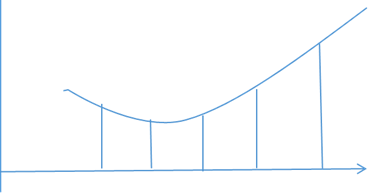 We can find an approximate value for such integralsbyb finding the area approximately. There are many methods methods of doing this and such methods include the Trapezium rule.
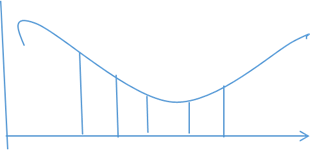
Y
Y = f(x)
y1 y2y3 yn-1yn
x1 x2 x3 xn-1xn
= ½ (y1 +y2)h + ½ (y2 +y3)h + ½ (yn-1 +yn)h
½ h(y1+2y2+2y3+……….+2yn-1 + yn)
½ (width of each trap. ) × (first ordinate + last ordinate )+ 2( sum of all other ord.)
F(x)dx = ½ h{y1 + yn} +2{y2 +y3 + …Yn}.
Example
Find the approximate value of at interval 0.5
| X | 1 | 1.5 | 2 | 2.5 | 3.0 |
| Y = 1/x | 1 | 0.67 | 0.5 | 0.4 | 0.33 |
Applying the rule;
{ ½ . ½ { (1 +0.33) + 2 ( 0.67 + 0.5 + 0.4)}
¼ {(1.33) +2(1.57)}
¼ (4.47) = 1.12.
1 0.67 0.5 0.4 0.33
Ex (2). Make a table of value of y for which y = for which x =2 t0 x = 3 at interval of 0.2.
| X | 2 | 2.2 | 2.4 | 2.6 | 2.8 | 3 |
| X2-1 | 3 | 3.84 | 4.76 | 5.76 | 6.84 | 8 |
| 1.732 | 1.956 | 2.182 | 2.4 | 2.615 | 2.828 | |
| 0.5754 | 0.5703 | 0.4583 | 0.4167 | 0.3824 | 0.3536 |
Using the rule.
= ½ *0.2 (0.5774 +0.3536 + 3.5354)
0.44664 *2
0.89 correct to 2 dp
APPLICATION OF INTEGRATION TO KINEMATICS
If the ve;locityis given as a function of time, the displacement is the integral of the velocity function with respect to the time .
ds/dt = f(t)
then S =
= f(t) + C
Similarly, if the acceleration is a function of time, the velocity is the integral of the acceleration function.
Ex. A particle is projected in a straight line from O until a speed of 6m/s is attained. At time t secs.Later,its acceleration is (1 + 2t) m/s2 for the value of t = 4. Calculate for the particle (i) its velocity (ii) its distance from O
dv/dt = 1+ 2t
v = = t + t2 + C
when t = 0
v = 6m/sand c = 6.
V = (t2 + t + 6) m/s
When t = 4, v = 16 + 4 + 6 = 26m/s.
(ii) distance (s) = ds/dt = t2 + t + 6
S =
S = {t3/3 + 16/2 6t}4
= 160/3
m.
Evaluation
1. Find the area enclosed byb y = x2 – x -2 and the x axis
2. find the area under the curve y = x2/3 between x = 2 and x = k is 8 times the area under the same curve between x = 1 and x =2, hence find the value of k.
GENERAL EVALUATION
- A particle moves in astraight line from O until the initial velocity was 2m/s. its acceleration is given by (2t -3)m/s2. Calc. (i) its velocity after 3 secs. (ii) the distance from O when it is momentarily at rest.
- Find the volume of solid revolution when a is the region bounded by the cuerve y = 2x. and the ordinate at x = 2,and x = 4 and the x axis is revolved by 2π.
Reading Assignment :F/Matrhs Project, pg 47 – 63
WEEKEND ASSIGNMENT
1. Integrate 2√x A. B.4x3/2 + C C. + C D.
2. Integrate A. + C B. x3/2 + C C. x2 + C D. + C
3. The gradient of a curve is 6x + 2 and it passes through the point (1,3), find its equation A. 3x2 – 2x + 2 B. 3x2 -2x -2 + 2x + 2 C. 3x2 – 2x + 2 D. 3x2 – 2x -2
4. Evaluate A. – + x2 – 2x + C B. x3/3 – x3/2 + x2 + 2x +C C. x3/3 + x2/2 +x3-2x + C D. x4/4+x3/3-x2+2x+C
5. Eval. A. 9 +C B. 8/3 + C C. 24 D. 18 + C
THEORY
- Evaluate
- Using trapezoidal rule, with ordinate x = -3,-2,-1,0,1,2,3 and 4. Calc correct to 3 dp an approximate value of
WEEK TEN
TOPIC: REGRESSION LINE AND CORRELATION COEFFICIENT
SCATTER DIAGRAM
Definition: a scatter diagram is a graphic display of bivariate data. A bivariate data involves two variables
TYPES OF SCATTER DIAGRAM:
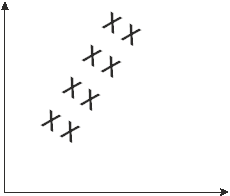
Linear positive correlation.
A positive correlation between two variables x any y means that in general, increase in x is accompanied by increase in y. The regression line has a positive slope.


X
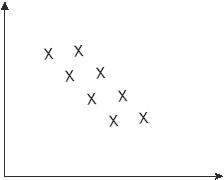
Linear negative correlation
A negative correlation between x and y means that an increase in x is accompanied by a decrease in y, negative correlation has a negative slope.

x
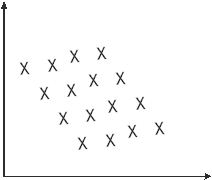
Zero Correlation:
 There is no apparent association between x and y.
y
Non Linear Correlation:
 Most of the points lie on or near a curve which is parabolic in shape. The parabolic curve is called a regression curve.
x
REGRESSION LINE OR LINE OF BEST FIT OR THE LEAST SQUARES LINE
There are two variables where one is dependent and the other is independent variable. The regression line can be fit using scatter diagram method and the least squares method.LEAST SQUARES METHOD: If x is independent variable and y dependent variable, that is y on x. then :The equation of the regression line is written as y = ax + b
Where a is the slope and b is the y – intercept. Given two sets of variables x and y it can be deduced that
a = n ∑ xy – ∑ x ∑ y
 ∑ x2 – ( ∑ x)2
 b = y a – ax

 Where x = ∑ x
ny = ∑ y
 n
n
Example: use the least square method to fit a regression line of y on x for the following dataX 3 5 6 9 11 14 15 18 Y 2 3 5 7 10 12 13 17 Find value of y when x = 8
SOLUTION:
X y Xy x2 3 2 6 9 5 3 15 25 6 5 30 36 9 7 63 81 11 10 110 121 14 12 168 196 15 13 195 225 18 17 306 324 ∑ x = 81 ∑ y = 69 ∑ xy = 893 ∑ x2= 1017  a = n ∑ xy – ∑x ∑ y= 8 (893) – 81x 69
n∑(x2 ) – ( ∑x)2 8 (1017) – (81)2
 a = 7144 – 5589 = 1555
 8136 – 6561 1575
a = 0. 9873
 x = ∑ x = 81 = 10.125
 n 8
n 8
 y = ∑ y = 69 = 8. 625
n 8
b = y – ax
b = 8.625 — 0.9873 (10.125)
= 8.625 – 9.996
b = -1.37
y = ax + b
y = 0.9873x – 1.37 (regression line of y on x )
When x = 8
y = 0. 9873 (8) – 1.37
y = 6.5284 ~ 6. 5
EVALUATION
Use the least square method to fit a regression line of y on x for the following dataX 1 4 5 7 8 10 12 16 19 20 Y 2 3 4 5 7 8 10 15 20 18 Use the line obtained to find the value of y when x = 9
CORRELATION COEFFICIENT
DEFINITION:
The correlation coefficient determines the amount or degree of linear relationship between two variables. The correlation coefficient is represented by r
The characteristics of r are as follows: - The value of r is the same irrespective of the variable labelled x or y.
- the value of r satisfies the inequality -1< x < + 1
- if r is close to +1, the variables are highly positively correlated. If r is close to -1 then, x and y are highly negatively correlated. If r is close to zero, the correlation between x and y is very low. There is no correlation between x and y when r = 0
There are two methods of obtaining the correlation coefficient.
- Pearson’s coefficient of correlation or product moment correlation coefficient
- Rank correlation coefficient.
RANK CORRELATION COEFFICIENT: It is also known as Spearman’s rank correlation coefficient and defined as :
 rk = 1 – 6 ∑ D2
n(n2 -1)
As the name implies, the variables (if not ranked) can be ranked in ascending order or descending order. Where there are ties, the average is used as the rank.Where D is the difference between the pairs of variables and n is the number of variables. D = Rx – Ry
Example:
The table below gives the examination marks of 10 students in mathematics and history.Maths 51 25 33 55 65 38 35 53 61 44 History 20 65 25 36 51 50 77 31 60 5 A Calculate the rank correlation coefficient
b) Comment briefly on your resultSOLUTION:
MATHS (x) HISTORY (y) Rx Ry D D2 51 20 5 9 -4 16 25 65 10 2 8 64 33 25 9 8 1 1 55 36 3 6 -3 9 65 51 1 4 -3 9 38 50 7 5 2 4 35 77 8 1 7 49 53 31 4 7 -3 9 61 60 2 3 -1 1 44 5 6 10 -4 16 ∑D2 = 178
rk = 1- 6 ∑D2
n(n2 – 1)=1 – 6 x 178
 10 (102 – 1)
1 – 1068/990
= 1-1.178= -0.078There is a very low negative correlation between the marks obtained in mathematics and history.
EVALUATION:
The table below shows the marks obtained by ten students in both theory (x) and practical (y) examination.X 50 70 85 35 60 65 75 40 45 80 Y 45 55 75 40 50 60 70 35 30 65 Calculate the rank correlation coefficient between x and y comment on your result.
PEARSON’S CORRELATION COEFFICIENT: It is fully called Pearson’s product moment correlation coefficient. It is simple to calculate and it does not recognise any of the variables as independent or dependent. It is obtained using the formula below.
r = n ∑ xy – ∑x∑ y
 √ [n∑(x2 ) – (∑x)2 ][n∑(y2) – (∑y)2
Example:
Calculate the product moment correlation coefficient for the following dataX 2 4 7 9 11 Y 1 2 3 7 9 Comment on your result.
SOLUTION:
X Y XY X2 Y2 2 1 2 4 1 4 2 8 16 4 7 3 21 49 9 9 7 63 81 49 11 9 99 121 81 ∑x = 33 ∑y = 22 ∑xy = 193 ∑x2 = 271 ∑y2 = 144  r = 5 x 193 – 33 x 22
√[5(271) – ( 33)2][5(144) – ( 22)2]
r = 965 – 726
√266 x 236
r = 239
250.55
r = 0.9539. r = 0.95 (approximately to 2 s.f)
Comment: The relationship between x and y is highly positive.EVALUATION: The following data are the marks obtained by five students in statistics (X) and mathematics(Y). Calculate the product moment correlation coefficient and comment on your result.
X 33 36 42 52 40 Y 42 46 38 62 52 GENERAL EVALUATION/REVISIONAL QUESTIONS
- If Cos A = 24/25 and Sin B= 3/5, where A is acute and B is obtuse, find without using tables, the values of (a) Sin 2A (b) Cos 2B (c) Sin (A-B)
- Use the addition formula to find the values of the following
(a)Sin 750 (b) cos 750 (c) tan 450
- Calculate the Product moment correlation coefficient and the Spearman’s rank correlation coefficient.
X 50 45 43 30 30 43 23 43 25 Y 12 13.5 14 11 12 15 13.5 12 14 READING ASSIGNMENT: Read correlation and regression.Page313–320. Further Mathematics project 2.
WEEKEND ASSIGNMENT
Use the table below to answer questions 1 and 2.Height 160 161 162 163 164 165 No of students 4 6 3 7 8 2 - The mean of the distribution is
(a) 4875.1 cm ( b) 4001.2 (c) 3571.0cm (d) 162.2 cm (e) 129.2cm
2. The median of the distribution is
(a) 160 (b) 162 (c) 163 (d) 164 (e) 165
3. Calculate the standard deviation of 3,4, 5,6,7,8,9
(a) 2 (b) 2.4 (c) 3.6 (d) 4.0 (e) 4.2
4. Calculate the mean deviation of 6 , 8 , 4 , 0 , 4
(a) 4 .0 (b) 3.6 (c) 3.0 (d) 2. 8 (e) 2 . 1
5. The table below shows the rank Rx and Ry of marks scored by 10 candidates in an oral and
written tests respectively. Calculate the spearman’s rank correlation coefficient of the data.
Rx 1 2 3 4 5 6 7 8 9 10 Ry 2 3 4 1 6 5 8 7 10 9 (a)51/55 b) 6/55 c)49/55 d)54/55 e) 61/55
THEORY
1 The distribution of marks scored in statistics and mathematics by ten students is given in the table below:Maths(x 11 20 23 42 48 50 57 64 80 90 Stat(y) 26 23 35 46 44 50 50 58 68 70 - Plot a scatter diagram for the distribution
- Draw an eye- fitted line of best fit
- Use your line to estimate the students marks in statistics if his mark in maths is 40
2. The table below gives the marks obtained by members of a class in maths and physics examination
STUDENTS A B C D E F G H I J Maths 85 75 59 43 74 69 62 80 54 63 Physic 92 72 62 48 85 73 46 74 58 50 - Calculate the product moment correlation coefficient.
- Comment on your result.
 There is no apparent association between x and y.
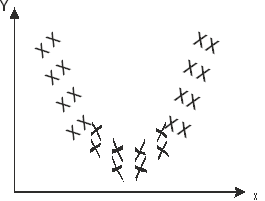 Most of the points lie on or near a curve which is parabolic in shape. The parabolic curve is called a regression curve.