Share this:
1. Figure 1 shows the path of array of yellow light through a glass prism. The speed of yellow light in the prisms is 1.88 x 10⁸m/s.
a) Determine the refractive index of the prism material for the light (speed of light in vacuum e = 3.0 x 10⁸ ms-1)
b) Show on the figure the critical angle, c, and determine its value.
c) Given that r = 21.2o, determine the angle q
d) On the same figure, sketch the path of the light after striking the prism if the prism was replaced by another of similar shape but lower refractive index. (Use dotted line for your answer)
2. Fig. 3. Shows the path of radiation form a radioactive source after entering a magnetic field. The magnetic field is directed into the paper and is perpendicular to the plane of the paper as shown in the figure.
Identify the radiation
b) Below is a nuclear reaction
232A 228 Y
![]()
![]() 90 K 88 X
90 K 88 X
i) Identify radiation K
ii) Determine the values of X and Y.
(c) Fig 3 shows a device for producing metal foils of constant thickness. Any change in thickness can be detected by the Geiger tube and recorded by the Geiger. The pressure adjusted by the roller is then adjusted to keep the thickness constant.
(i) State the change in the metal foil that will lead to a decrease in the Geiger counter reading
(ii) Give a reason for your answer in c(i) above
(iii) State the change in the roller pressure that should be made as a result of this decrease in the Geiger counter reading.
(iv) Give a reason for your in (c) (iii) above
![]() (v) Explain why a source emitting (alpha) particles only would not be suitable for this device.
(v) Explain why a source emitting (alpha) particles only would not be suitable for this device.
(vi) Explain why a radioactive source of a half-life of 1600 years is more suitable for use in the device than one of a half-life of 8 minutes.
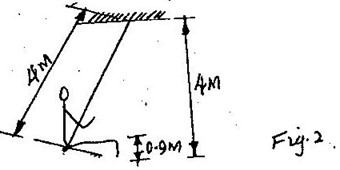
3. Fig. 4 shows a block of a mass 30.0 kg being pulled up a slope by a force P at a constant speed. The friction force on the block is 20.0N.

a i) On the same figure name and indicate the other forces acting on the block.
ii) Determine the component of the weight acting on the trolley down the slope
iii) Determine the value of P.
b) On reaching the top of the slope, the block is left to run freely down the slope.
i) Which one of the forces previously acting on the block would then act in the opposite?
ii) Determine the acceleration of the block down the slope.
iii) What is the effect of increasing the angle of slope on your answer in (ii) above.
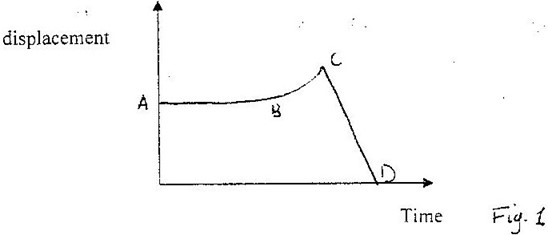
![]() 4. a) Fig 5. Shows the variation of temperature, T (0C), with time, t (seconds). When frozen water is heated for sometime.
4. a) Fig 5. Shows the variation of temperature, T (0C), with time, t (seconds). When frozen water is heated for sometime.
(i) Explain the shape of the curve at the parts labeled AB and C.
A B C
observed that when the temperature starts to rise, the volume initially decreases and then increases. State the reason for this observation.
(iii) In the fig. 5 sketch and explain the curve that would be obtained if frozen water was used. (Hint: specific heat capacity for seawater is lower what of fresh water.
(b) Determine the quantity of heat energy required to change 3.0 kg of ice at 00 C to water at 5 0C. Specific latent heat of fusion of ice is 3.36 x 10⁵ J/kg. Specific heat capacity of water is 4200J/kgK)
 5 a) Fig 6.1 shows the cross- section of a ripple tank full of water. A piece of cork floats on the surface of the water as shown. Fig 6 II shows the water surface viewed from above. A straight edge vibrator placed at the end A of ripple tank generates water waves, which travel towards end B as shown.
(i) Identify the type of waves generated on the water surface.
(ii) It is observed that as the waves pass the cork, there is no net movement on
the cork. Explain this observation
(iii) A student estimates that successive waves pass the cork every 0.20 seconds. If the speed of the waves is 0.30 ms-1 , determine the frequency and wavelength of the waves at that point.
iv) In the space provided, sketch the wave fronts as viewed from a point above the ripple tank.

v) Explain the answer in part (iv) above
b) A tuning fork is sounded at the mouth of a pipe whose one end is closed with a moveable piston. Resonance is observed successively when the piston is 77cm and then at 129 cm. If the speed of sound in air is 340ms -1, determine the frequency of the tuning fork.
6. a) State the law that relates the volume of a gas to the temperature of a gas.
b) Fig 7. shows an experiment set-up that may be used to investigate one of the laws. The glass tube has a uniform bore and it is graduated in millimeters
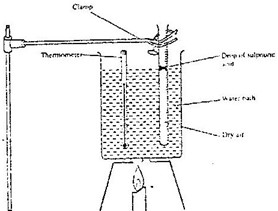
i) Describe how the experiment was carried out and explain how the results obtained verify the law.
ii) Limitations of the set up are?
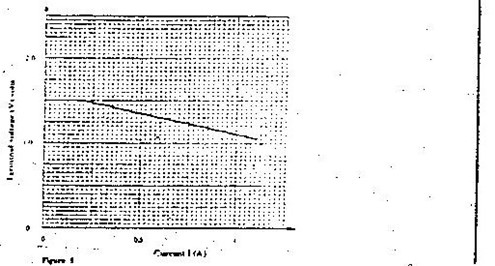
c) In an experiment to find the relation between pressure, p, and temperature, q, of a gas at a constant volume, values of temperature were determined. The results obtained are shown in the graph below.
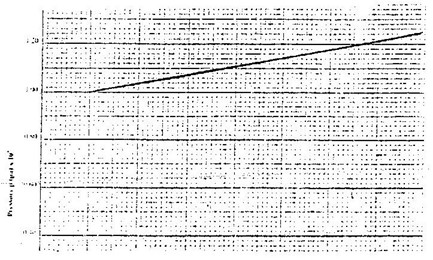
(i) From the graph, determine the pressure at a temperature of 273K.
(ii) Assuming the relation p/T0+q = constant holds for this graph determine the value of the constant T0
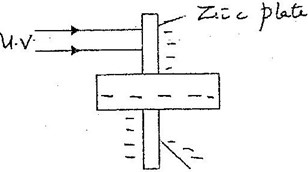
Explain the following observations
i) The leaf of the electroscope falls.
ii) When the same experiment was repeated with a positively charged electroscope the leaf did not fall.
bi) State two factors which determine the speed of photoelectrons emitted by a metal surface
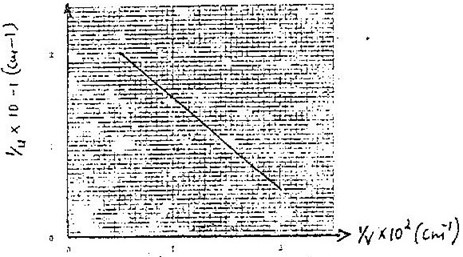
ii) In an experiment using a photocell, u, v. light of varying frequency but constant intensity was made to strike a metal surface. The maximum kinetic energy (K.E max)of photoelectrons for each frequency, was measured. The graph shows how KE max varies with f.
Given that KE max = hf – F , determine the value of the constants h and j form the graph.
c) Light of frequency 5.5 x 10¹⁴ Hz is made to strike a surface whose work function is 2.5eV.
Show that photoelectric effect will not take place.(Use the value of h from (b) above.