
Share this:
1 a) Distinguish between longitudinal and transverse waves
Longitudinal waves – Transverse waves –
b) In the Young’s double slit experiment, and interference pattern of bright and dark fridges was formed as shown in figure 1 by alight of wavelength coming from two narrow slits X and Y.
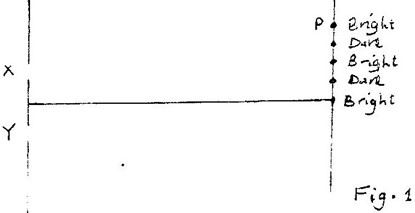
i) Write an expression for the path difference between XP and YP where corresponds to the 2nd bright fringe.
ii) Explain how the dark and bright fringes are formed.
iii) State and explain what would be observed on the screen if the slits X and Y were made large.
c) Figure 2 represents a displacement – time graph for a wave.
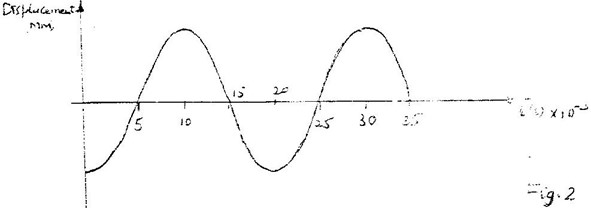
i) Determined the frequency of the wave.
ii) Sketch on the same axes, the displacement – time graph of a wave of the same frequency but 180o out of phase and with a smaller amplitude.
2 a) An object O placed in front of a converging lens Lo forms an image 1 on the other side of the lens. Another converging lens LC placed such that the two lenses form a compound microscope.
i) Draw a reason of the set up and sketch the rays to show how the final image is formed.
ii) Give a reason why the focal length of Lo must be greater than that of Lc
b) An object is placed 30cm from a converging lens. A focused image is formed on a screen placed 30cm from the same lens on the other side. The screen in now moved 5cm towards the lens. Determine the distance the object must be moved so that a focused image is formed on the screen.
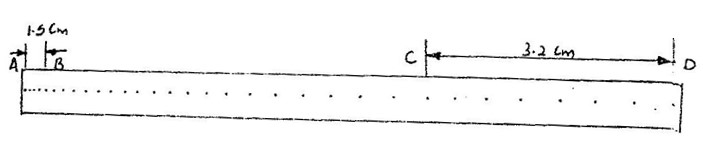 3. A tape attached to a moving trolley is run through a ticker timer. Figure 3 shows a section of the tape after running.
Figure 3.
If the frequency of the ticker – timer is 50Hz, determine the:
i) Average velocity at intervals AB and CD.
ii) A average acceleration of the trolley.
b) A stone is released from a height, h. if the acceleration due to gravity is g, derive an expression of the velocity of the stone just before hitting the ground.
c) Figure 4 (a) shows a velocity – time graph of an object in motion.
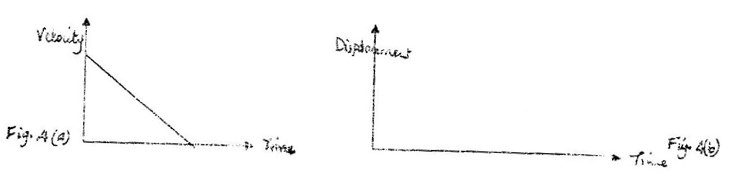
Sketch on the axes provided in figure b4 (b0, the displacement – time graph of the Motion
(Motion upwards is taken as positive.
4. Figure 5 represents a simple voltage amplifier circuit.
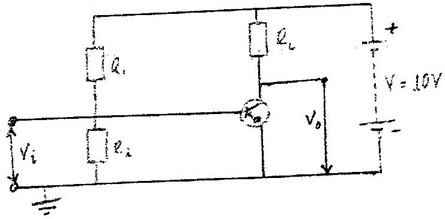
Figure 5
a) i) Identify the transistor in the circuit.
ii) Explain how the base bias is produced.
iii) Describe how an alternating signal that is fed in the input V1 is amplified.
b) When a signal is fed in the input, the collector current is 2.5mA. If the current gain is 62.5 and the voltage across the transistor (VCE) is 4.5V determine the :
i) Power rating of the heater ii) Current flowing in the circuit.
5a) A circuit consists of a battery, a metal wire, an ammeter and a switch connected in series. The switch is closed and the ammeter reading noted. The metal wire is now heated. State the observations made on the ammeter reading and give a reason for your answer.
b) An electric heater is made of a wire of resistance 100W and connected to a 240V mains supply. Determine the:
i) Power rating of the heater ii) Current flowing in the circuit.
iii) Time taken for the heater to raise the temperature of 200g of water
from 23oC to 95oC.(Specific heat capacity of water is 4200-1K-1)
iv) Cost of using the heater for two hours a day for 30 days.(The power and lighting company charges Kshs 5.00 per kilowatt – hour).
SECTION II
6a) Explain the following observations: ice cube float on water and solid
benzene sinks in liquid benzene.
bi) You are provided with the following:
-An overflow can – A beaker -A spring balance
– A metal block -Water and – String
Describe an experiment to verify Archimedes principle.
ii) A block of wood weighing 2.0N is held under water by a string attached to the bottom of a container. The tension in the string is 0.5N. Determine the density of the wood.
ci) Define half – life of a radioactive material.
ii) Figure 6 shows a graph of the variation of the number of atoms of a certain radioactive material with time.
Figure6: Determine the half – life of the material
7a) Figure 7 shows a photoelectric cell cirucuit:
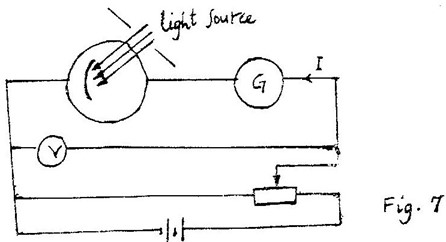
The intensity of the light can be varied.
i) Describe how the circuit may be used to show how the current I varies with the potential difference V across the cell.
ii) Sketch on the same axis graphs of I versus V for three different values of light intensity E1E2 and E3 such that E3>E2>E1
b) Using a circuit similar to the one in figure 7. with the polarity of the batteries reversed, the frequency, of the light was varied at constant intensity. For each frequency, the potential difference was varied until the current was equal to zero. The value of this voltage, Vco was noted. The graph in figure 8 shows the relation between Vco and the frequency , of the incident light.Feom the graph, determine the:
i) Value of planks constant, h (charge an electron e = 1.6 x 10⁻¹⁹Colubomb)
ii) Work function, j , of the cathode surface of the cell . (Give your answers to 2 decimal places.)