Share this:
THIRD TERM E-LEARNING NOTE
SUBJECT: MATHEMATICS CLASS: SS2
SCHEME OF WORK
WEEK | TOPIC |
1 | Circle Theorem: Tangent properties of circle; Angles in alternate segment; Two tangent from a circle at external point. |
2 | Trigonometry: Derivative of sine rule and cosine rule and their applications. |
3 | Bearing and Distances; Elevation and Depression. |
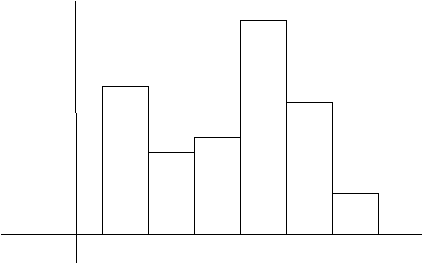
4 | Statistics: Class boundaries, class mark, and cumulative frequencies of grouped data, and histogram. |
5 | Statistics: Cumulative frequency curve (Ogive); Using ogive to calculate the median, quartile, percentile and decile. |
6 | Review of the First Half Term Work and Periodic Test. |
7 | Statistics: Mean, median, and mode of grouped data. |
8 | Probability: Introduction; use of dice, coins and playing cards. |
9 | Probability: Addition and multiplication rules of probability; Mutually exclusive, independent, and complementary events; Experiment with or without replacement. |
10 | Revision |
REFERENCE BOOKS
1.New General Mathematics SSS2 by M.F. Macrae etal.
2. Essential Mathematics SSS2 by A.J.S. Oluwasanmi.
3. Exam Focus Mathematics.
WEEK ONE
TOPIC:TANGENTS FROM AN EXTERNAL POINT
Theorem:
The tangents to a circle from an external point are equal.
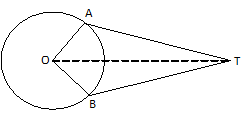
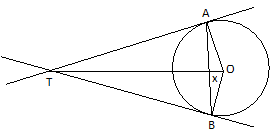
Given: a point T outside a circle, centre O, TA and TB are tangents to the circle at A and B.
To prove: |TA| = |TB|
Construction: Join OA, OB and OT
In ∆s OAT and OBT
![]()
![]() OAT = OBT = 900 (radius tangent)
OAT = OBT = 900 (radius tangent)
|OA| = |OB| (radii)
|OT| = |OT| (common side)
∆OAT = ∆OBT (RHS)
|TA| = |TB|
Note that
Example:
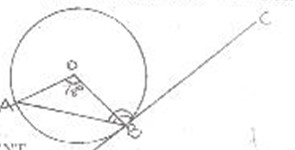
1.In the figure below O is the centre of the circle and the TA and TB are tangents if
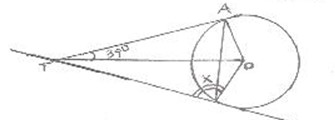
In ∆TAX
AXT = 900 (Symmetry)
TAX = 180 – (900 + 390) sum of angles of ()
1800 – 1290 = 510
TBX = 510 (symmetry)
OR
∆ ATB is an Isosceles triangle
|AT| =|BT| (tangents from external point)
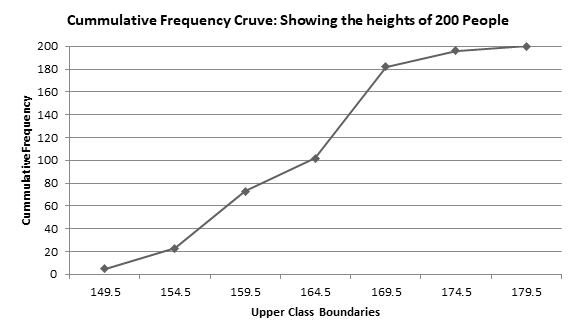
< ATB = 2(39) = 780
2TBX = 1800 – 780 (sum of angle in a 2 TBX = 1020 TBX= 1020 2 TBX = 510 2.PQR are three points on a circle Centre O. The tangent at P and Q meet at T. If < PTQ = 620 calculate PRQ. Solution Join OP and OQ In quadrilateral TQOP POQ = 3600 – (900 + 900 + 620) sum of angle in a quadrilateral) POQ = 3600 – 2420 POQ = 1180 PRQ = 1180 = 590 (2x angle at circumference = angle at centre) 2 PR1QR is a cyclic quadrilateral R + R1 = 1800 (opp. angles of a cyclic quadrilateral ) R1 = 1800 – R R1 = 1800 – 590 R1 = 1210 PRQ = 590 or 1210 Evaluation 1. ABC are three points on a circle, centre O such that GENERAL EVALUATION/REVISION QUESTIONS 1. AB is a chord and O is the centre of a circle. If AOB = 780 calculate the obtuse angle between AB and the tangent B. 1 The dimension of a cuboid metal is 24cm by 21cm by 10cm, if the cuboid is melted and used in making a cylinder whose base radius is 15cm find the height of the cylinder. 2 The volume of a cylinder is 3600cm3 and its radius is 10cm calculate its (a) curve surface area (b) total surface area READING ASSIGNMENT Essential Mathematics, pages149-151, numbers 11-20. WEEKEND ASSIGNMENT Use the diagram below to answer the questions. 1.If < ATO = 360 ,calculate < ABO. (a) 360 (b) 720 (c) 180 (d) 440 2.If 3.If< BTO = 440, calculate 4.If |AB| = 18cm and |TB| = 15cm, calculate |TX| (a) 180 (b) 330 (c) 780 (d) 120 5.If < AOT = 470, calculate ABO (a) 470 (b) 940 (c) 1330 (d) 430 THEORY 1.O is the centre of a circle and two tangents from a point T touch the centre at A and B. BT is produced to C. If 2.AD is a diameter of a circle,AB is a chord and AT is a tangent. a) State the size of WEEK TWO Topic: Cosine and Sine Rule Relating to Triangle. Content -Sine Rule for Acute and Obtuse Angled Triangle. -Application of Sine Rule to Triangle. -Cosine Rule for Acute and Obtuse Angled Triangle. -Application of Cosine Rule. Sine Rule for Acute and Obtuse Angled Triangle. Consideration is given to other triangles than a right angled triangle. The angles of any triangle are denoted by capital letters such as; A, B, C, while the sides are represented by small letters; a, b, c, respectively. c b Acute Triangle: This is a type of triangle in which the angles are less than 900. Obtuse Triangle: Is a type of triangle in which one of the angles is more than 900 but less than 1800. Deductive Proof of Sine Rule The sine rule is the same for acute and obtuse angled triangle. Given: Any triangle ABC (acute-angled or obtuse-angled triangle). c b B a C Sin A SinB Sin C Proof: c In fig. 7.10 a) b In fig.7.10 b) b Hence, Sin C = h [sin(180 – Ɵ ) = sin Ɵ] ……………(2) From (1) h = c SinB From(2) h = b Sin C Hence, cSinB=bSinC b = c Example In triangle ABC, A= 380, B = 270, and b = 17cm. find a and c. Solution; Using sine rule; Sin A = Sin B A a = 17 sin 380 a = 23cm C B To find c; Angle C must be known; A + B + C = 1800 C = 1800 – 380 – 270 , C = 1150 b c c= 33.9 approximately, c = 34cm. NB: In any triangle, the longest side correspond to the largest angle while the shortest side corresponds to the smallest angle. Evaluation: 1. Solve the ∆ completely; A = 390, a = 8.2m and b = 5.6m 2.Calculate the values of angles P and R of ∆ PQR, where q = 14.35cm, p = 7.82cm and Q = 115.60 Deductive Proof of Cosine Rule The cosine rule is also the same for the acute and obtuse angled triangle. A bh c b h B a C x a-x N x C a+x a To prove: c2 = a2 + b2 – 2abCos C Construction: Draw a perpendicular from A to B(produced if necessary). Proof: Using the acute triangle; using the obtuse triangle; c2 = (a-x)2 + h2 c2 = (a +x)2 + h2 c2 = a2 -2ax + x2 + h2 c2 =a2+2ax+x2+h2 c2 = a2 + b2 – 2ax From ACN,x/b=CosACN x =bCosC =Cos(1800-C) = -Cos C ,x= -bCos C c2 = a2 + b2 – 2abCosC c2 = a2 + b2 +2a(-bCos C) c2 = a2 + b2 – 2abCos C Similarly, for other sides and angles. Therefore the cosine rule can be written as thus: a2= b2 + c2 – 2bcCosA 2ab 2bc Cos B = a2 + c2 – b2 Conditions Necessary for Use: The rule is used for solving acute and obtuse angled triangles in which two sides and included angles are given. Example Given that A = 1200, b = 7cm, c= 12cm. Solve the triangle completely. Solution Using cosine rule; a2 = b2 + c2 – 2bcCosA a2= 72 + 122 – 2(7×12)Cos 1200 a2= 49 + 144 – 168 (-0.5) a2 = 193 +84 a = 16.6cm. To find angle B, Cos B = a2 + c2 – b2 Cos B = 16.62 + 122 – 72 Cos B = 275.56 + 144 – 49 Cos B = 0.9301, B = cos-10.9301, B = 21.50. To find < C; < A + < B + C = 1800 – 1200 – 21.50, C = 38.50. Hence, a = 16.6cm, B = 21.50 and C = 38.50. NB: 1. In any triangle, the longest side corresponds to the largest angle and the shortestside to the smallest angle. 2. It is advisable to always find the smallest angle first , since the angle must be acute. Evaluation 1.Calculate the angles of the ∆s ABC whose sides are given in centimeters.Give the final answers to the nearest 0.10 a=5.2, b = 6.5cm ,c = 7.8 General Evaluation 1.Calculate the smallest angle in the triangle PQR such that p = 7.92m, q= 15.9m and c= 8.44m. 2.Calculate the length of the side opposite the given angle in ∆ XYZ given that x =13.1m, y = 24.2m and Z = 47.80. Revision Questions 1 Given that sin Ɵ =5/13 for 0<Ɵ<900 find a sinƟ -cosƟ b cos Ɵ -3 tanƟ 2 If cos 3y=sin 2y find y for 0 Reading Assignment Essential Mathematics SSS2, page 180-181, exercise13.2, nos 11-15;exercise 13.4,page 185,nos 1a-1f. Weekend Assignment Objectives Use the information below to answer question 1 – 3. In ∆ABC, a = 7.8m, b= 8.5m and B = 57.70. correct answers to 1 d.p. 1. Find A; A. 50.90 B. 510 C. 71.40 D. 700 2. Find C; A. 510 B. 71.40 C. 710 D. 800 3. What is c? A.10m B. 12m C. 9m D. 9.5m 4. In ∆ ABC, b = 4cm, c= 5cm and A = 1150. Find a to 2 s.f. A. 7.66cm B 7.6cm C.8cm D.7.7cm 5. In ∆PQR, p=1.8cm q = 2.5cm and r = 3.6cm. Calculate P. A. 27.50 B. 300 C. 320 D.280 Theory 1.A triangle has sides of length 7cm, 8cm, 9cm. Express the cosine of the smallest angle of the triangle as a fraction in its lowest terms. 2.Solve the triangle completely in the ∆ABC such that B = 34.50, c = 2.8cm, ‽ a = 5.1cm. WEEK THREE TOPIC: BEARINGS AND DISTANCES Angle of Elevation This is the angle formed between the normal eye level and the line through which the observer view an object above. C B Angle ACB = Ө = Angle of elevation. Angle of Depression: This is the angle formed between the eye level of the observer and the object below when the observer is above the object at view. The angle of elevation is alternate to the angle of depression and problems involving angles of elevation and depression could be solved by using the basic trigonometric ratios and in some cases the sine and cosine rule could be applied. Sine Rule for ∆ ABC; a = b = c Cosine Rule: a2 = b2 + c2 – 2bc Cos A b2 = a2 + c2 – 2ac Cos B c2 = a2 + b2 – 2ab Cos C EXAMPLES: Solution: Q Ladder = QR, Wall = QP 50m Cos 650 = PR 50 Cross multiplying PR = 50 x Cos 650 = 50 x0.4226 PR = 21.13m Solution: A Distance between the foot of the tower and the object = BC Tan 550 = AC, tan 550 = 60 60m BC BC Cross multiplying; BC x Tan 550 = 60 BC = 60/tan 550 BC = 42m (nearest whole number) EVALUATION From the top of a building 10m high, the angle of elevation of a stone lying on the horizontal ground is 700. Calculate correct to 1 decimal place, the distance of the stone from the foot of the building and the distance of the stone from the top of the building. FURTHER EXAMPLES: Pole = BE, AD = Point above the ground. 1.54m A B 20m BC = AD = 1.54m, AB = CD = 20m (opposite & parallel sides). To obtain CE, using triangle CDE; Tan 400 = CE/CD, Tan 400 = CE/20 Cross multiplying; CE = 20 x tan 400 = 20 x 0.8391 CE = 16.782m Therefore, Height of the pole (BE) = 1.54 + 16.782 = 18.322m = 18.3m (3 sig. fig) Using ∆ BDC, Tan Ө = 1.54/20 Ө = tan-1(0.077) = 4.410 Solution: D 8m C x B Height of the tower is AB, using ∆ACB, Tan 430 = AB/x AB = x tan 430 ……………………eqn 1 From ∆ ADB, Tan 320 = AB/(8 + x) AB = (8 + x) tan 320 ……………………eqn 2 Equating the two equations: x tan 430 = (8 + x) tan 320 x tan 430 = 8tan 320 + x tan 320 x tan 430 – x tan 320 = 8tan 320 x(tan 430 – tan 320) = 8 tan 320 tan 430 – tan 320 x = 8 x 0.6249 = 4.9992 x = 16.252m Height of the tower = AB = x tan 430 = 16.252 x 0.9325 = 15.15499m Height of the tower = 15.2m EVALUATION The feet of two vertical pole of height 3m and 7m are in line with a point P on the ground, the smaller pole being between the taller pole and P and at a distance of 20m from P. The angle of elevation of the top (T) of the taller pole from the top (R) of the smaller pole is 300. Calculate: BEARING AND DISTANCES Bearings can be defined as the angular relationships between two or more places. Bearings are specified in two ways: Cardinal Points: It is specified in reference to the north and south. E.g N450E, S600W Example NOP = 600 is the bearing N600E Three Digits Notation: Bearing is also specified in three digits notation. E.g 0600, 0780,1350,2250 e.t.c 2. Write each of the following in three digit notation. (a) S 700E (b) N400W It is equivalent to 3200 Evaluation Find the equivalent of the following in three digit notation. 1. S 750W 2. N 350E 3.S 300E 4.N620W Bearing of One Point from Another It is possible to determine the bearing of one point or location from another point, if the starting point is known. Examples 1.Find the bearing of A from B if B from A is 1400. Solution; A from B = ? B from A = 1400 A from B =2700 + 500 =3200 2.If the bearing of P from Q is 0750, find the bearing of Q from P. R from P = 180 + 75 Evaluation: Find the bearing of X from Y, if Y from X is 2100. The Sine rule and Cosine rule are the basic rule used to solve bearing related problems. Sine rule; Sin A = Sin B = Sin C or a = b = c Cosine rule; c2 = a2 + b2 – 2abCosC a2 = b2 + c2 – 2bcCosA b2 = a2 + c2 – 2acCosB Examples 1. A fly moves from a point U on a bearing of 0600, to a point V 20m away. It then moves from the point V on a bearing of 1300, to a point W. If the point W is due east of U. Find the distance of the point V from W and U from W. Solution U + V + W = 1800 ( sum of angles in a ∆ ) W = 1800 – 300 – 1100, W = 400 To find the distance V from W, using sine rule; Sin U = Sin W sin 300 = sin 400 u = 15.56mdistance V from W = 15.6m (3 s.f) Distance u from w; sin U = sin V v = 15.6 x sin 1100 v = 29.32 hence, distance of u from w = 29.3m (3 s.f). 2.A village R is 10km from a point P on a bearing 0250 from P. Another village A is 6km from P on a bearing 1620. Calculate (a) distance of R from A (b)the bearing of R from A. (a) Distance R from A, using cosine rule: p2 = q2 + r2 – 2qr Cos P P2 = 102 + 62 – 2(10 x 6) Cos 1370 P2 = 100 + 36 – (120) x( -0.7314) P2 = 136 + 87.768 Distance R from Q = 15km approximately. (b)Bearing of R from Q, Let the bearing be x, to find x, find A first a p 14.96 Q = sin-10.4559, Q = 27.10 But, Q = 18 + x 27.10=18+x x=27.10 – 18=09.10 The bearing of R from Q is 0090. Evaluation City A is 300km due east of city B.City C is 200km on a bearing of 1230 from city B.How far is it from C to A? General Evaluation: 1)Find the corresponding bearing of the following: (a)N640W (b)0640 (c)S420E (d) 2340 2)If the bearing of X from Y is N640W.Find the bearing of Y from X. 3)A boat sails 6km from a port X on a bearing of 0650 and thereafter 13km on a bearing of 1360. What is the distance and bearing of the boat from X. 4. Find the angle of elevation to the nearest degree of the top of a church tower 180m high from a point on the ground 75m from its foot. Revision Questions 1 From a place 400m north of X, a student walks eastward to a place Y which is 800m from X. What is the bearing of X from Y 2 In a circle of radius 18cm, two radii form an angle of 1500 at the centre from point X and Y on the circumference. Find correct to three significant figure (a) the length of the chord XY (b) the length of the major arc (c) the area of the minor segment Reading Assignment Essential Mathematics SSS2, pages 195-197, nos 1-10. Weekend Assignment Objectives 1. What is the equivalent of S700E in three digit notation? A. 1100 B. 0700 C.1200 D.1000 2. If the bearing of P from R is 0650, what is R from P? A. 2300 B.2450 C. 1200 D 0250 3. Express the true bearing 2100 as a compass bearing. A S300W B S600W C.N300W D.S600E 4. Town Q is on a bearing 2100 from town P, town R is on a bearing 1500 from town P and R is east of Q. The distance between R and P is 10km. Find the distance between R and Q. A. 10km B. 20km C.30km D. 40km 5. What is the bearing of M from N, if the bearing of N from M is 3150? A.0650 B. 0150 C. 0450 D. 0250 Theory 1. P, Q and R are points in the same horizontal plane. The bearing of Q from P is 1500 and the bearing of R from Q is 0600. If |PQ| = 5m and |QR| = 3m. Find the bearing of R from P correct to the nearest degree. 2.The angles of elevation of the top T, of a tower, 25m high are observed from point A at the top of a building to be 380 and from point B at the bottom of the building to be 65.40. If the tower and the building are on the same horizontal level, calculate (a) BT (B) the height of the building. Give your answers correct to 3 s.f. WEEK FOUR TOPIC:STATIASTICS CONTENT When data has a large number of values, it is cumbersome to prepare its frequency table; hence the data are organized into classes or groups to overcome this problem. E.g 0 – 4, 5 – 9, 10 – 14 e.t.c. The range of the classes is first considered before we group the data. When data is divided into groups, it is called a grouped frequency distribution. Grouped frequency distribution: The groups into which the data are arranged are called class intervals e.g 15 – 19 Class Limit: The number of each class intervals is called class limits of that interval. Consider the class interval 20 – 24, 20 = lower class limit, 24 = upper class limit Class Boundaries: When data is given to the nearest unit, the class interval 34 – 37, has a lower class boundary of 33.5 and upper class boundary of 37.5. Consider the intervals below: 20 – 24, 25 – 29 ETC. To obtain the class boundaries of 25 – 29, 24 + 25 = 24.5, 29 + 30 = 29.5 2 2 Class Width: This is the difference between the upper class boundary and the lower class boundary. Class Marks: This is the centre or mid-point of any class interval. It is obtained by finding the average of the lower and upper limits. Find the class mark of the following class intervals 40 – 44, 45 – 49, 50 – 54 etc. Class Interval Class Mark 40 – 44 40 + 44 = 42 2 45 – 49 45 + 49 = 47 2 Cumulative Frequency Table: This is the table that shows the cumulative frequency of each of the classes and it is the running total of the frequencies class by class, giving the total frequency. EXAMPLE: In a mock examination for the final year Chemistry class, the following were obtained by 50 students. 71 63 70 45 59 82 61 79 37 89 33 56 39 42 64 73 59 67 72 60 46 36 61 87 91 67 54 72 39 43 57 65 45 52 35 46 64 37 95 86 76 73 67 71 74 82 61 59 58 43 Using class interval 31 – 40, 41 – 50 … e.t.c Construct a table showing the following columns: class interval, class boundary, class mark, frequency and cumulative frequency. Class interval Frequency Class boundary Class mark Cumulative Frequency 31 – 40 6 30.5 – 40.5 35.5 6 41 – 50 9 40.5 – 50.5 45.5 6 + 9 = 15 51 – 60 9 50.5 – 60.5 55.5 9 + 15 = 24 61 – 70 11 60.5 – 70.5 65.5 11 + 24 = 35 71 – 80 9 70.5 – 80.5 75.5 9 + 35 = 44 81 – 90 4 80.5 – 90.5 85.5 4 + 44 = 48 91 – 100 2 90.5 – 100.5 95.5 2 + 48 = 50 EVALUATION The following figures show how many people visited an art gallery each day for 50 days. Using class interval 11 – 20, 21 – 30 … e.t.c Construct a table showing the following columns: class interval, boundary, class mark, frequency and cumulative frequency. 30 60 53 54 35 51 13 36 43 44 44 38 39 52 45 39 25 27 31 44 29 46 49 42 47 43 34 52 50 39 53 25 28 51 54 33 35 45 51 59 19 28 34 42 48 51 20 25 37 38 HISTOGRAM This is a type of bar chart, each bar corresponding to one mark and with its length proportional to the frequency of that mark. The class marks or centres, class boundaries can be used on the variable scale. In histogram, the bars are joined together and must be of equal width, except when dealing with unequal class interval. The following table shows the distribution of marks scored by a class of 80 students. Marks 10 – 14 15 – 19 20 – 24 25 – 29 30 – 34 35 – 39 Frequency 18 9 11 25 14 3 Draw a histogram for the distribution. Solution Class Interval Class Mark Frequency 10 – 14 12 18 15 – 19 17 9 20 – 24 22 11 25 – 29 27 25 30 – 34 32 14 35 – 39 37 3 20 – 15 – 10 – 5 – 0 9.5 14.5 19.5 24.5 29.5 34.5 39.5 Class boundaries EVALUATION Draw a histogram to illustrate the data shown below. Heights(cm) 120 – 129 130 – 139 140 – 149 150 – 159 160 – 169 170 – 179 Frequency 6 15 31 37 9 2 GENERAL EVALUATION 1. Construct a table showing the following columns: class interval, class boundary, class mark, frequency ,and cumulative frequency for the distribution shown below. Shoe Sizes 5 – 9 10 – 14 15 – 19 20 – 24 25 – 29 30 – 34 35 – 39 No of students 5 7 6 2 3 4 3 2. Draw a histogram for the distribution. READING ASSIGNMENT New General Mathematics SSS1, page 180, exercise 14e, numbers 2,3,4 and 7. WEEKEND ASSIGNMENT: 1. The thickness of 20 samples of steel plate are measured and the results (in mm) to two significant figures are as follows: 7.3 7.1 6.6 7.0 7.8 7.3 7.5 6.2 6.9 6.7 6.5 6.8 7.2 7.4 6.5 6.9 7.2 7.6 7.0 6.8 Construct a table showing the following columns: class interval, class boundary, class mark, frequency and cumulative frequency, using class interval 6.2 – 6.4, 6.5 – 6.7 e.t.c 2. The following table shows the distribution of the masses of 120 logs of wood, correct to the nearest kg. Masses (kg) 15 – 24 25 – 34 35 – 44 45 – 54 55 – 64 Frequency 14 54 24 26 2 WEEK FIVE TOPIC: PRESENTATION OF DATA Cumulative Frequency Curve The cumulative frequency curve is also called the OGIVE. It is the graph of the cumulative frequency against the upper class boundary. Example The table below shows the height of 200 people who were randomly picked. Heights(cm) 145 – 149 150 – 154 155 – 159 160 – 164 165 – 169 170 – 174 175 – 179 Frequency 5 18 50 29 80 14 4 Construct for the distribution above, a cumulative frequency curve. Solution: Heights Frequency Cumulative Frequency Upper Class Boundary 145 – 149 5 5 < 149.5 150 – 154 18 23 < 154.5 155 – 159 50 73 < 159.5 160 – 164 29 102 < 164.5 165 – 169 80 182 < 169.5 170 – 174 14 196 < 174.5 175 – 179 4 200 < 179.5 The table shows the masses of a various quantities of maize sold by a farmer during the year 1985. Mass (kg) 40 – 43 44 – 47 48 – 51 52 – 55 56 – 59 60 – 63 64 -67 68 – 71 Frequency 7 18 32 48 41 28 17 19 GENERAL EVALUATION Given the frequency distribution below. Draw a histogram and a cumulative frequency curve. Height (cm) 160 – 164 165 – 169 170 – 174 175 – 179 180 – 184 185 – 189 190 – 194 Frequency 10 25 40 56 44 20 5 READING ASSIGNMENT New General Mathematics SSS2, page164, exercise 14b. WEEKEND ASSIGNMENT The following table shows the distribution of the masses of 120 logs of wood, correct to the nearest kg. Masses (kg) 15 – 24 25 – 34 35 – 44 45 – 54 55 – 64 Frequency 14 54 24 26 2 1. Draw a histogram for the distribution. 2. Make a cumulative frequency table for the distribution. 3. Draw a cumulative frequency curve for the distribution. 4. Use the graph to find the a. semi-interquartile range.b. 60th percentile. WEEK SIX REVIEW OF THE FIRST HALF TERM WORK AND PERIODIC TEST WEEK SEVEN MEAN, MEDIAN AND MODE OF GROUPED DATA MEAN: The arithmetic mean of grouped frequency distribution can be obtained using: Class Mark Method: X = where x is the midpoint of the class interval. Assumed Mean Method: It is also called working mean method. X = A + (∑ Fd/∑f) Where, d = x – A, x = class mark and A = assumed mean. EXAMPLE: The numbers of matches in 100 boxes are counted and the results are shown in the table below: Number of matches 25 – 28 29 – 32 33 – 36 37 – 40 Number of boxes 18 34 37 11 Calculate the mean (i) using class mark (ii) assumed mean method given that the assumed mean is 30.5. Solution: Class interval F X FX d = x – A Fd 25 – 28 18 26.5 477 29 – 32 34 30.5 1037 0 0 33 – 36 37 34.5 1276.5 4 148 37 – 40 11 38.5 423.5 8 88 Total 100 3214 164 = 30. 5 + (164/100) =30.5 + 1.64 = 32.14 = 32 matches per box (nearest whole number) EVALUATION: Calculate the mean shoe sizes of the number of shoes represented in the table below using (i) class mark (ii) assumed mean method given that the assumed mean is 42. Shoe sizes 30 – 34 35 – 39 40 – 44 45 – 49 50 – 54 No of Men 10 12 8 15 5 MODE The mode of a grouped frequency distribution can be determined geometrically and by interpolation method. Mode from Histogram: The highest bar is the modal class and the mode can be determined by drawing a straight line from the right top corner of the bar to the right top corner of the adjacent bar on the left. Draw another line from the left top corner to the bar of the modal class to the left top corner of the adjacent bar on the right. Example: The table gives the distribution of ages of students in an institution. Ages(year) 16 – 18 19 – 21 22 – 24 25 – 27 28 – 30 No of Students 18 30 35 24 13 Draw a histogram and use your histogram to estimate the mode to the nearest whole number. Solution: Class Interval (Ages) F Class Boundary 16 – 18 18 15.5 – 18. 5 19 – 21 30 18.5 – 21.5 22 – 24 35 21.5 – 24.5 25 – 27 24 24.5 – 27.5 28 – 30 13 27.5 – 30.5 35 30 10 5 15.5 18.5 21.5 24.5 27.5 30.5 Histogram Modal class = 22 – 24 Mode = 21.5 + 0.9 = 22.4, approximately 22 yrs. MODE FROM INTERPOLATION: The mode can be obtained using the formula. Mode = Lm + Where Lm = lower class boundary of the modal class. ∆1 = difference between the frequency of the modal class and the class before it. ∆2 = difference between the frequency of the modal class and the class after it. C = class width of the modal class. Example: Using the table given in the example above: Modal class = 22 – 24, ∆1 = 35 – 30 = 5, ∆2 = 35 – 24 = 11, C = 3, Lm = 21.5 = 21.5 + (15/16) = 21.5 + 0.9375 = 22.44, approximately 22 yrs. MEDIAN OF GROUPED DATA: The median of grouped data can be determined from a cumulative frequency curve and from the interpolation formula. Median from Cumulative Frequency Curve: The cumulative frequency curve can be used to determine the median. EXAMPLE: The table below shows the masses of 50 students in a secondary school Masses (kg) 10 – 14 15 – 19 20 – 24 25 – 29 30 – 34 35 – 39 40 – 44 Frequency 3 7 9 5 11 6 9 Solution: 50 * 45 40 * 35 * 30 20 * 15 10 * 5 * 0 Masses(kg) Frequency Cumulative Frequency Upper Class Boundary 10 – 14 3 3 < 14.5 15 – 19 7 10 <19.5 20 – 24 9 19 <24.5 25 – 29 5 24 < 29.5 30 – 34 11 35 < 34.5 35 – 39 6 41 < 39.5 40 – 44 9 50 < 44.5 14.5 19.5 24.5 29.5 34.5 39.5 44.5 Upper Class Boundary Cumulative Frequency Curve Showing the Masses of 50 Students. To find the median, find (N/2) and check the table on the curve. Therefore, N/2 = 50/2 = 25th Check 25th on the cumulative frequency and trace to the upper class boundary. Median = 29.5 + 0.5 = 30kg MEDIAN FROM INTERPOLATION FORMULA fm Where, L1 = lower class boundary of the median class. Cfm = cumulative frequency of the class before the median class. Fm = frequency of the median class. C = class width of the median class. N = Total frequency The median class: 30 – 34, L1 = 29.5, cfm = 24, fm = 11, C = 5 11 = 29.5 + 5 = 30kg EVALUATION: Calculate the modal shoe sizes and median of the number of shoes represented in the table below using interpolation and graphical method. Shoe sizes 30 – 34 35 – 39 40 – 44 45 – 49 50 – 54 No of Men 10 12 8 15 5 GENERAL EVALUATION: The table below gives the distribution of masses (kg) of 40 people Masses (kg) 1 – 5 6 – 10 11 -15 16 – 20 21 – 25 26 – 30 31 – 35 36 – 40 Frequency 9 20 32 42 35 22 15 5 READING ASSIGNMENT New General Mathematics SSS2,page 160, exercise14a. WEEKEND ASSIGNMENT The table gives the frequency distribution of a random sample of 250 steel bolts according to their head diameter, measured to the nearest 0.01mm. Diameter (mm) 23.06 – 23.10 23.11 – 23.15 23.16 – 23.20 23.21 – 23.25 23.26-23.30 23.31 – 23.35 23.36-23.40 23.41-23.45 23.46-23.50 No of bolts 10 20 28 36 52 38 32 21 13 WEEK EIGHT TOPIC: PROBABILITY (EVENT AND OUTCOME) CONTENT 1. Definition of terms 2. Events and outcome (measuring probability) (a) Experimental probability (b) Theoretical probability DEFINITION OF TERMS (i)Event: When an experiment is performed two or more results or outcomes will be expected to happen. Each attempt is called a trial and the outcome of a trial and the outcome of a trial is called an event, usually denoted by E. (ii)Random Experiment: A random experiment is a repetitive process which may result in any one of the possible outcomes of the experiment OR: (iii)Sample space: The sample space of a random experiment is the set containing all the possible outcomes of the experiment OR: Sample space is all the possible outcomes of a trail in an experiment usually denoted by S. (iv)The number of the points in a sample space n(s), and in an event, E is n(E). Examples 1. When a coin is tossed twice, all the possible outcomes i.e. the sample space S = {HH, HT,TH, TT} \ n(s) = 4 2. If a die is cast once, there are six outcomes. \ the sample space , S = {1, 2, 3, 4, 5, 6} \ n(S) = 6 Suppose an event E that an even number is thrown, then E = {2, 4, 6} and n(E) = 3. 3. A box contain 16 red, 6 white, and 18 blues balls. The sample spaces, S = {16 + 6 + 18) balls n (S) = 40 4. When a die is tossed twice, the outcome of the first toss S1 = (1, 2, 3, 4, 5, 6) does not influence the outcome of the second throw. S2 = (1, 2, 3, 4, 5, 6). The two outcomes are independent of each other. For instance, the chance of throwing a5 in the first toss is 1/6 does not influence the chance of the throw of 2 in the second toss (i.e. 1/6); they are Independent Event. Equally likely events: Two or more events are said to be equally likely to happen if the chance of occurrence of each of the same.e.g. 1.In the throw of a die, there are six equally likely outcomes, S = {1, 2, 3, 4, 5, 6} the change of each occurring is 1 out of 6 c.c. 1/6. 2.From a pack of 52 cards, the chance of picking any of the cards at random is 1/52. PROBABILITY The probability of an event is the chance of its occurrence, that is the likelihood of the event happening with respect to the sample space. Prob. Of E = number of elements in E___ number of total elements in S \P(E) = n(E) n(S) NOTE: Probability of an event lies between 0 and 1 i.e. O then the prob. that it will not occur is 1 – P(E). 1. In a class of 27 boys and 12 girls, what is the probability of picking a girl. 2. A no is chosen at random from 40 to 50, find the probability that it is a prime number. 3. If all 2-digits numbers 00, 01, 02, …….99 are equally likely to be chosen, find the probability that a number picked at random has 5 as its first digit. EXPERIMENTAL AND THEORETICAL PROBABILITY EXPERIMENTAL PROBABILITY Experimental Prob = no of required outcome no of possible outcome Example A die is rolled 200 times, the outcome obtained are shown below. No 1 2 3 4 5 6 No. of Outcomes 25 30 45 28 40 32 Find the experimental probability of obtaining (a) 6 (b) 2 n(S)200 25 = 0.16 (b) P(2) = n(2) = 30 = 3 = 0.15 Since experimental probability uses numerical records of past events to predicts the future, its predictions are not absolutely accurate, however the probability of throwing a 2 on a fair 6-sided die is 1/6, since any one of the 6 faces is equally alike. This is an example of theoretical probability. THEORETICAL PROBABILITY Theoretical probability is the assumed value assigned to the occurrence of an event based on the assumption that each of the elements in the outcome are equally likely to happen i.e. by considering the physical nature of the given situation. Examples Tola throws a fair six-sided die, what is the probability that she throws (a) a 9 (b) a 4 (c) a no greater than 2 (d) an even no (e) either 1, 2, 3, 4, 5, or 6? Solution a. Since the faces of a six sided die are numbers 1, 2, …6, it is impossible to throw a 9. \ P (9) = 0 b. There is a chance out of 6 chances of throwing 4 \ P(4) = 1/6 c. S = {1, 2, 3, 4, 5, 6} , n (S) = 6 no > 2 = {3, 4, 5, 6} , n(<2) = 4 n(s) d. There are 3 possible even number S = {1, 2, 3, 4, 5, 6}, n (S) = 6 even no = {2, 4, 6} n (even) = 3 P(even) = n (even) = 3/6 = ½ e. Either 1, 2, 3, 4, 5, 6 S = {1, 2, 3, 4, 5, 6} n (S) = 6n (r) = 6. P(r) = n(r)= 6/6 = 1 Example 2 A bag contains 3 red, 5 green and 7 white balls, if a ball is selected from the bag, what is the probability that the ball is green? Total no. of balls, n(S) = 3 + 5 + 7 = 15 Event E = green balls \n(E) = 5 \P(E) = n(E) = 5 = 1 n(S) 15 3 EVALUATION Use the figure below to answer the following: 16 2 3 13 5 11 10 8 9 7 6 12 4 14 15 1 (a) If a number is picked at random from the figure. What is the probability that it is:- (i) Odd (ii) Prime (iii) even (iv) less than 10 (v) Exactly divisible by 3 (vi) a perfect square (vii) a perfect cube? (b) If a row or column is picked at random from the figure. What is the probability that the total of its no is(i) 34 (ii) 35 GENERAL EVALUATION 1 A bag contains black balls, 3 green balls and 4 red balls, A ball is picked form the bag at random, what is the probability that it is (a) Black (d) yellow (c) Green (d) not black (d) either black ore red 2 A school contains 357 boys and 323 girls, if a student is chosen at random, what is the probability that a girl is chosen. READING ASSIGNMENT NGM SSS2, page113-114, exercise11a, numbers 1-12. WEEKEND ASSIGNMENT OBJECTIVE (a) ½ (b) 1/3 (c) 5/6 (d) 2/3 2 A number is chosen at random from the set (11, 12, 13, ….25) what is the probability that the number is odds?(a) 7/15 (b) 8/15 (c) 1/4 (d) 3/4 3 A box contains 8 blues 6 yellow and 10 green balls , one all is picked at random from the box, what is the probability that the ball is yellow. (a) 1/3 (b)½ (c) 3/4 (d) 5/12 4 A coin is tossed twice, what is the probability of obtaining at least a head (a) 3/4 (b) 1/3 (c) 2/5 (d) 1/2 5 A letter is chosen at random from the word PROBABILITY, what is the probability that the letter is a vowel? (a) 3/11(b) 4/11 (c) 5/11 (d) 6/11 THEORY 1 Two groups of male students X and Y cast their votes in an election of an officer; he results are as shown in the table below: In favour Against Group X 152 48 200 Group Y 88 62 150 240 110 a. How many students participate in the election? b. If a student in favour of the officer is selected, what is the probability that he is from group X? c. A student is choosen at random, what is the probability that he is against the officer? 2 A ltter is choose at random from the alphabet. Find the probability that it is (a) M (b) not A or Z (c) Either P, Q, R, or S (d) One of the letters of NIGERIA. WEEK NINE TOPIC: PROBABILITY: CONTENTS MUTUALLY EXCLUSIVE AND INDEPENDENT EVENTS APPLICATION OF TREE DIAGRAM IN SOLVING PROBLEMS Mutually Exclusive Event Mutually exclusive events are events which cannot together at the same time. One event will pave way for the other, in such a case the separate probability are added together probabilities are added to give the combined probability. Additional Law of Probability If event A,B,C…. are mutually exclusive, the probability of A or B or C or…. Happening is the sum of their individual probabilities. P(A) + P(B) + P(C) + …….. Note: use the addition law to solve problems that contains the word or or either/or. Worked Examples: A bag contains 3 red balls, 4 blues balls 5 white balls and 6 black balls. A ball is picked at Random, what is the probability that it is either: Solution P(R) = 3/18 P(B) = 4/18 P(W) = 5/18, P(BK) =6/18 (a)Pro(either red or blue) = 3/18 + 4/18 = 7/18 (b) Pro(blue or black) = 4/18 6/18 = 10/18 = 5/9 (c)P(red white or blue) = P(r) +P(w) + P(blue) = 3/18 + 4/18 + 5/18 =12/18 = 2/3 (d) P(blue, white or black) = P(blue) + P(white) + P(black) = 4/18 + 5/18 + 6/18 = 15/18 = 5/6 (e)P(neither Red or blue) = P(R or blue)1 = 1-P(R or blue) = 1- 7/18 = 11/18 Worked Example 2 A letter is choosen at random from the word “COMPUTER” what the probability that it is (a) either in the word cut or in the word ROPE (b) neither in the word MET nor in the word UP? Solution: n(s) = 8 (a) P (either word CUT or ROPE) = P (CUT) + P(ROPE) = 3/8 + 4/8 = 7/8 (b) P(MET +UP)1 = 1- 5/8 = 3/8 Evaluation F={2, 3, 7} and T = {10, 20, 30, 40} (a) If one element is selected at random, from F, write down the probability that it is odd. (b) If one element is selected at random from T, write down the probability that it is a multiple of 5 (c) If one element is selected at random, from FUT write down the probability of 42 or a multiple of 4 INDEPENDENT EVENT Independent event are event which have no effect on each other. In such cases the Separate probabilities are multiplied to give the combined probability. Product Law If event A, B, C is independent, the probability of A and B and C and …. Happening is the product of their individual probabilities P(A) x P(B) x P(c) …… Note: use the product law to solve problems that contains the words “and” or both/and Worked Example: A coin is tossed and a die is then thrown what is the probability of getting a head and a perfect square Solution P(H and perfect square) P(H) = ½ (Perfect square = (1,4) n (perfect square) = 2 n(s) = 6 P (perfect square) = 2/6 = 1/3 \ P (H and perfect square) = `1/2 x 1/3 = =1/6 WorkedExample 2: A bag contains 3 black balls and 2 white balls (a) A ball is taken from the bag and then replaced, A second ball is chosen, what is the probability that (i) They are both black (ii) One is black and one is white (iii) at least one is black (iv) at most one is black Solution. With Replacement i P(BB) = 3/5 x 3/5 = 9/25 ii Probabilities that one is black and one is white = P(BW) or P(WB) P(one white one black) = P(BW) + P(WB) = 3/5 x 2/5 + 2/5 x 3/5 P(BW) or P(WB) = 6/25 + 6/25 = 12/25 iii Prob ( at least one is black) = P( both are black) + P(one is black) = P(BW) + P (WB) +P(BB) = 12/25 + 9/25 = 21/25 iv At most one is black means either one is black or non is black i.e one is black or both are white. P(at most one black) = P(BW) + P(WB) + P(WW) = 6/25 + 6/5 + 4/25 = 16/25 Evaluation A box contains 5 blue balls 3 green balls. (a) A ball is taken from the box and then replaced.A second is chosen is chosen,what is the probability that (i)they are both blue (ii)one blue and one is green (iii)at least one is blue GENERAL EVALUATION 1.A box contains ten marbles,seven of which are black and three are red.Three marbles are drawn one after the other without replacement.Find the probability of choosing a) one red,one black and one red marble(in that order). b) two black marbles c) at least two black marbles d) at most two black marbles READING ASSIGNMENT NGM SSS2,page115-116, Exercise 11b, 1-10. Objectives 1. Two fair dice tossed together at once find the probability that the sum of the outcome is at least 10(a) 1/12 (b) 3/15 (c) 5/36 (d) 2/5 2 form a box containing 2 Red, 6 white and 5 black balls, a ball is randomly selected , what istheprobability that the selected ball is black.(a) 5/12 (b) 5/13 (c) 4/5 (d) 7/13 3. A bag contains 3 red, 4 black and 5 green identical balls, 2 balls are picked at random one after the other without replacement, find the prob that one is red and the other is green (a) 5/22 (b) 7/23 (c) 15/132 (d) 12/13 4. A bag contains 3 white, 6 red and 5 blue identical balls, a ball is picked at random from the bag, what is the prob. that it is either white or blue? (a) 9/14 (b) 5/14 (c) 4/7 (d) 6/7 5. A bag contains red, black and green identical balls,a ball is picked andReplaced at 100 times.The table below shows the result of the 100 trails, What is the probability of picking a green ball. Colour Red Black Green No. of occurrence 54 30 16 (a)21/25 (b)16 (c)4/25 (d)1/3 THEORY 1. A box contains 5 blue balls, 3 black balls and 2 red balls of the same size. A ball is selected at random, from the box and then replaced. A second ball is then selected, find the probability of obtaining. (a) Two red balls (b) Two blue balls or 2 black balls (c) One black and one red ball in any order. 2. Solve the same problem if it is without replacement.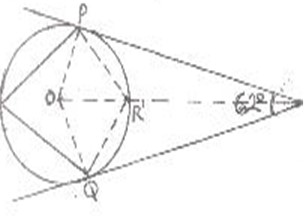

 A
A![]() B a C
B a C
 A
A![]()
![]()
![]()
![]() To prove: a = b = c
To prove: a = b = c![]() Construction: Draw a perpendicular A to BC ( produced, if necessary)
Construction: Draw a perpendicular A to BC ( produced, if necessary)![]() Sin B = h ……………………………………(1)
Sin B = h ……………………………………(1)![]() . Sin C = h ……………………………………..(2)
. Sin C = h ……………………………………..(2)![]() Sin(1800 – C ) = h
Sin(1800 – C ) = h![]() b
b![]()
![]() SinB SinC
SinB SinC
![]()
![]()
 a b
a b
![]() sin 380 = sin 270 38
sin 380 = sin 270 38![]() a 17
a 17![]() sin 270
sin 270![]()
![]()
![]() Sin B = Sin C
Sin B = Sin C![]()
![]() sin 270 = sin 1150 , c = 17 x sin 1150
sin 270 = sin 1150 , c = 17 x sin 1150![]() 17 c sin 270
17 c sin 270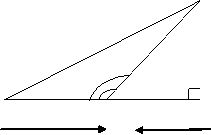
![]()
![]()
![]()
![]() Given: any ABC
Given: any ABC![]()
 (a) A
(a) A (b)c
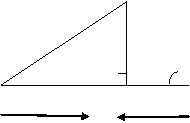
(b)c![]() B N
B N![]() From ∆ ACN; b2 = x2 + h2, and Cos C = x / b From ACN,x2+h2=b2
From ∆ ACN; b2 = x2 + h2, and Cos C = x / b From ACN,x2+h2=b2![]() x= b Cos C =a2+2ax+b2
x= b Cos C =a2+2ax+b2![]() c2 = a2 + b2 – 2abCosC OR Cos C = a2 + b2 – c2
c2 = a2 + b2 – 2abCosC OR Cos C = a2 + b2 – c2
![]() b2 = a2 + c2 – 2acCosB Cos A = b2 + c2 – a2
b2 = a2 + c2 – 2acCosB Cos A = b2 + c2 – a2
![]() 2ac
2ac![]() a =√277
a =√277![]() 2ac
2ac![]() 2x 16.6 x12
2x 16.6 x12![]() 398.4
398.4![]()
 A
A![]()
![]()
![]() Ө
Ө![]()
![]()
 Angle ABC = Ө = Angle of Depression. B Ө
![]()
![]() AC
AC![]()
![]()
![]() Sin A Sin B Sin C
Sin A Sin B Sin C Distance between the foot of the ladder and the wall = PR
![]()
![]()
![]()
![]() P 650 R
P 650 R![]()
![]() 550 Tower = AC, Object = A
550 Tower = AC, Object = A![]()
![]()
![]() BC BC = 60/1.428 = 42.02m
BC BC = 60/1.428 = 42.02m![]()
 Solution:E
![]() 400
400
![]()
 D C
D C![]()
![]()
 A
A
![]()
![]()
![]()
![]()
![]() 320 430
320 430![]() x = 8 tan 320
x = 8 tan 320![]() 0.9325 – 0.6249 0.3076
0.9325 – 0.6249 0.3076
![]()
![]()
 Taking O as the starting point.
![]() SOQ= S470W
SOQ= S470W
![]()
![]()
![]()
![]()
![]() Example1. Indicate the following bearing on the cardinal point (a) 0800 (b) 2100
Example1. Indicate the following bearing on the cardinal point (a) 0800 (b) 2100 Solution
![]()
![]()
 (a) 0800, ( b) 2100
![]()
![]()
![]()
![]()
![]()
![]()
![]()
![]()
![]()
![]()
![]() Solution:
Solution:
![]()
![]()
![]() (a)S 700E
(a)S 700E![]()
![]()
![]()
![]()
![]()
![]()

![]() It is equivalent to 1100
It is equivalent to 1100![]()
![]() (b) N 400W
(b) N 400W![]()
![]()
![]()
![]()
![]()
![]()
![]()
![]()
![]() Solution;
Solution; P from Q = 0750
 ![]()
![]() = 2550
= 2550![]()
![]()
![]()
![]()
![]()
![]()
![]() a b c Sin A Sin B Sin C
a b c Sin A Sin B Sin C![]()
![]()

![]()
![]()
![]()
![]()
![]()
![]()
![]()
![]()
![]()
![]() u w
u w![]()
![]() u 20, u = 20 sin 300
u 20, u = 20 sin 300![]() sin 400
sin 400![]()
![]() u v
u v![]() sin 30 = sin 1100
sin 30 = sin 1100![]() 15.6 v
15.6 v![]() sin 30
sin 30![]()
 Solution:
![]()
![]()
![]()
![]()
![]()
![]()
![]()
![]() P = √223.768, p = 14.96km
P = √223.768, p = 14.96km![]()
![]() Sin Q = Sin P
Sin Q = Sin P![]() Sin A = Sin 1370
Sin A = Sin 1370![]() 10 14.96
10 14.96 ![]() Sin Q = 10 x Sin1370
Sin Q = 10 x Sin1370
![]()
 25 –
25 –
 EVALUATION
![]()
![]()
![]()
![]()
![]()
![]()
![]()
![]()
![]()
![]()
![]() 25
25![]()
![]() 20
20![]()
![]() 15
15![]() 0
0![]() Mode = 21.5 + 5 3
Mode = 21.5 + 5 3![]() 5 + 11
5 + 11
![]()
![]()
![]() 25 *
25 *![]()
![]() Median = L1 + N/2 – cfmC
Median = L1 + N/2 – cfmC![]()
![]() Median = 29.5 + 25 – 24 x 5
Median = 29.5 + 25 – 24 x 5
EVALUATION
![]()
![]()
![]() (a) P(6) = n(6) = 32 = 4
(a) P(6) = n(6) = 32 = 4 ![]()
![]()
![]() n(S) 200 20
n(S) 200 20![]() P (no >2) = n(no>2) = 4/6 = 2/3
P (no >2) = n(no>2) = 4/6 = 2/3![]() n (S)
n (S) ![]() n(S)
n(S) ![]()
![]() 1 What is the probability of throwing a number greater than 4 with a single fair die.
1 What is the probability of throwing a number greater than 4 with a single fair die.
![]()
![]()
![]()
![]()
![]()
![]()
![]() WEEKEND ASSIGNMENT
WEEKEND ASSIGNMENT![]()