Share this:
Statistics II Questions
1. The table below shows the number of defective bolts from a sample of 40
No of bolts | 0 | 1 | 2 | 3 | 4 | 5 |
Frequency | 20 | 8 | 6 | 4 | 1 | 1 |
Calculate the standard deviation of the data above (4 mks)
2. The table below shows the masses to the nearest kg of all the students of marigu-ini secondary. School.
Masses (kg) | No. of students |
30-34 | 5 |
35-39 | 7 |
40-44 | 10 |
45-49 | 10 |
50-54 | 19 |
55-59 | 20 |
60-64 | 20 |
65-69 | 6 |
70-74 | 2 |
75-79 | 1 |
- Taking the assumed mean A=52kg
Calculate:
- the actual mean mass of the students. (3 marks)
- the standard deviation of the distribution. (3 marks)
- Draw a cumulative frequency curve and use it to estimate the number of students whose masses lie
between 44.5kg and 59.5kg. (4 marks)
3. Sixty form four students in Tahidi high sat for a mathematics examination. Their marks were grouped into seven classes as follows: 30 – 34, 35 – 39, 40 – 44, 45 – 49, 50 – 54, 55 – 59, 60 – 64 and then named as cheetah, lion, zebra, rabbit, giraffe, elephant and buffalo respectively. The form 4 students population was then analyzed in the form of a pie-chart as shown below.
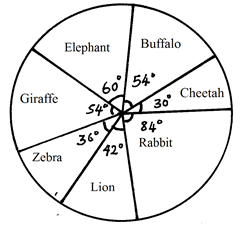
Using the information above
(a) Complete the table below.
Name | Marks | No. of students |
Cheetah Lion Zebra Rabbit Giraffe Elephant Buffalo | 30-34 35-39 40-44 45-49 50-54 55-59 60-64 |
(2mks)
(b) Calculate the inter quartile range. (3mks)
(c) Using an assumed mean of 47, calculate the standard deviation of the data. (5mks)
4. At an agricultural Research Centre, the length of a sample of 50 maize cobs were measured and recorded as shown in the frequency distribution table below.
Length | 8 – 10 | 11 – 13 | 14 – 16 | 17 – 19 | 20 – 22 | 23 – 24 |
No. of Labs | 4 | 7 | 11 | 15 | 8 | 5 |
a) State the modal class and size. (2mks)
Calculate
b) the mean (3mks)
c) (i) the variance (3mks)
(ii) the standard deviation. (2mks)
5. The table below shows the masses to the nearest kg of a number of people.
Mass (kg) Frequency | 50 – 54 19 | 55 – 59 23 | 60 – 64 40 | 65 – 69 28 | 70 – 74 17 | 75 – 79 9 | 80 – 84 4 |
a)Using an assumed mean of 67.0, calculate to one decimal place the mean mass.
(b) Calculate to one decimal place the standard deviation of the distribution.
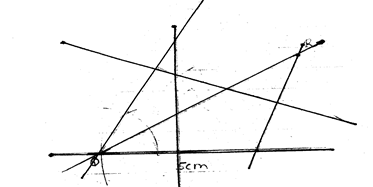
6. Use only a ruler and pair of compasses in this question;
(a) construct triangle ABC in which AB = 7cm, BC = 6cm and AC = 5cm
(b) On the same diagram construct the circumcircle of triangle ABC and measure its radius
(c) Construct the tangent to the circle at C and the internal bisector of angle BAC. If these
lines meet at D, measure the length of AD
![]()
![]()
![]()
![]()
![]()
![]()
![]()
![]()
![]()
![]()
![]()
![]()
![]()
![]()
![]()
![]()
![]()
![]()
![]() 7. Below is a histogram drawn by a student of Got Osimbo Girls Secondary School.
7. Below is a histogram drawn by a student of Got Osimbo Girls Secondary School.

![]()
![]()
- Develop a frequency distribution table from the histogram above.
b) Use the frequency distribution table above to calculate;
i) The inter-quartile range.
ii) The sixth decile.
8. ABC is a triangle drawn to scale. A point x moves inside the triangle such that
i) AX ≤ 4 cm
ii) BX CX
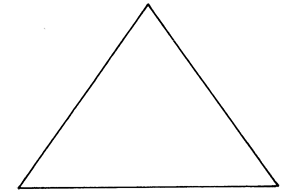 iii) Angle BCX ≤ Angle XCA.
Show the locus of X.
![]()
![]()
![]()
9. The following able shows the distribution of marks of 80 students
Marks | 1-10 | 11-20 | 21-30 | 31-40 | 41-50 | 51-60 | 61-70 | 71-80 | 81-90 | 91-100 |
Frequency | 1 | 6 | 10 | 20 | 15 | 5 | 14 | 5 | 3 | 1 |
(a) Calculate the mean mark
(b) Calculate the semi-interquartile range
(c) Workout the standard deviation for the distribution
10. The table below shows the marks of 90 students in a mathematical test
Marks | 5-9 | 10-14 | 15-19 | 20-24 | 25-29 | 30-34 | 35-39 |
No. of students | 2 | 13 | 31 | 23 | 14 | X | 1 |
- Find X
- State the modal class
(c) Using a working mean of 22, calculate the; i) Mean mark ii) Standard deviation
11. (a) Using a ruler and a pair of compasses only construct triangle PQR in which PQ = 5cm,
PR = 4cm and PQR = 30o
(b) Measure; (i) RQ
(ii) PQR
(c) Construct a circle, centre O such that the circle passes through vertices P, Q, and R (d) Calculate the area of the circle
12. The ages of 100 people who attended a wedding were recorded in the distribution table below
Age | 0-19 | 20-39 | 40-59 | 60-79 | 80-99 |
Frequency | 7 | 21 | 38 | 27 | 7 |
a) Draw the cumulative frequency
b) From the curve determine: i) Median ii) Inter quartile range iii) 7th Decile iv) 60th Percentile
13. The marks obtained by 10 students in a maths test were:-
25, 24, 22, 23,
x, 26, 21, 23, 22 and 27
The sum of the squares of the marks, x2 = 5154
(a) Calculate the: (i) value of x (ii) Standard deviation
(b) If each mark is increased by 3, write down the:-
(i) New mean
(ii) New standard deviation
14. 40 form four students sat for a mathematics test and their marks were distributed as follows:-
Marks | 1 – 10 | 11- 20 | 21- 30 | 31 – 40 | 41 – 50 | 51 – 60 | 61 – 70 | 71 – 80 | 81 – 90 | 91 – 100 |
No. of students |
1 |
3 |
4 |
7 |
12 |
9 |
2 |
1 |
0 |
1 |
a) Using 45.6 as the working mean, calculate;
i) The actual mean.
ii) The standard deviation.
b) When ranked from first to last, what mark was scored by the 30th student?
(Give your answer correct to 3 s.f.)
15. The table below shows the distribution of marks scored by pupils in a maths test at Nyabisawa
Girls.
Marks | 11 – 20 | 21 – 30 | 31 – 40 | 41 – 50 | 51 – 60 | 61 – 70 | 71 – 80 | 81 – 90 |
Frequency | 2 | 5 | 6 | 10 | 14 | 11 | 9 | 3 |
a)Using an Assumed mean 45.5, calculate the mean score.
b) Calculate the median mark.
c) Calculate the standard deviation.
d) State the modal class.
16. The table below shows the marks scored in a mathematics test by a form four class;
Marks | 20-29 | 30-39 | 40-49 | 50-59 | 60-69 | 70-79 | 80-89 |
No. of students | 4 | 26 | 72 | 53 | 25 | 9 | 11 |
(a) Using an assumed mean of 54.5, calculate:-
(i) The mean
(ii) The standard deviation
(b) Calculate the inter quartile range
Statistics II Answers
1 |
|
M1
M1
M1
A1 |
fx
fx2
Allow 1.293976429 | ||||||||||||||||||||||||||||
4 |
1.
Mass kg | Mid term x |
F |
d = x A |
fd |
d2 |
fd2 |
50 – 54 55 – 59 60 – 64 65 – 69 70 – 74 75 – 79 80 – 84 | 52 57 62 67 72 77 82 | 19 23 40 28 17 9 4 | -15 -10 -5 0 5 10 15 | -285 -230 -200 0 85 90 60 | 225 100 25 0 25 100 225 | 4275 2300 1000 0 425 900 900 |
f = 140 | fd = – 480 | fd = 9800 |
Marks awarded for √ table as follows:-
f = 140 BI
Column for d B1
Column for fd B1
fd = – 480 B1
√Column for d2 = 9800 B1
fd = 9800B1
x =A + fd
f
= 67.0 + – 480
140
= 67.0 – 3.43 = 63.57 ………… M1
= 63.6 kg …………… A1
Standard deviation = fd2 – fd
f f
= 9800 – (3.43)2
140
= 58.24 = 7.631
= 7.6
2. = 8/150 + 6/150 + 9/300 + 3/ 300
= 40/300 = 2/15
- Construction of AB B1
Construction of BC B1
Construction of AC B1
b) Construction of bisect of AC B1
Construction of bisect BC B1
Radius 3.6 cm B1
c) Construction of bisect < CAB B1 OC B1
Construction of AD B1 AD = 12.8cm B1
3. a)
Class | f | x | d = A – x | fd | d2 | fd2 |
41 – 50 51 – 55 56 – 65 66 – 70 71 – 85 | 20 60 60 50 15 | 45.5 53 60.5 68 73 | 15 7.5 0 -7.5 -12.5 | 300 450 0 -375 187.5 | 225 56.25 0 56.25 156.25 | 4500 3375 0 2812.50 2343.75 |
∑fd 562.5 | ∑fd2 13031.25 |
b) S = ∑fd2
– ∑fd
∑f ∑f
S = 13031.25 – 562.5
205 205
= 63.567 – 7.529
= 56.038
= 7.486
4. 15 (ax)4 (-2/x2) = 4860
60a4 = 4860
a4 = 81
a = 3
5.
Marks(x) | Freq.(f) | fx | d=x-x | d2 | Fd2 |
5.5 15.5 25.5 35.5 45.5 55.5 65.6 75.5 85.5 95.5 | 1 6 10 20 15 5 14 5 3 1 | 5.5 99 255 710 682.5 277.5 917 377.5 256.5 95.5 | -40.45 -30.45 -20.45 -10.45 -0.45 9.55 19.55 29.55 39.55 49.55 | 1636 927.2 418.2 109.2 0.2025 91.20 382.2 873.2 1564 2455 | 1636 5563 4182 2184 3038 456 535 4366 4692 2455 |
f=80 | f99x=3676 | fx233,923 |
Mean =
fx = 3676
f 80
= 45.95
(b) Q1 = 30.5 + 3 x 10
14
= 62.64
S.I.R = ½ (62.64 -32)
= 15.32
(c) Standard deciation
= fd2 = 33923
f 80
= 20.59
6. a) x = 90 – (2 +13 + 51 + 27 + 14 + 1)
= 90 – 84 = 6
b) 15 – 19
c) i)
Class | x | f | D= x-A | fd | D2 | Fd2 |
5-9 | 7 | 2 | -15 | -30 | 225 | 450 |
10-14 | 12 | 13 | -10 | -130 | 100 | 1300 |
15-19 | 17 | 31 | -5 | -155 | 25 | 775 |
20-24 | 22 | 23 | 0 | 0 | 0 | 0 |
25-29 | 27 | 14 | 5 | 70 | 350 | 4900 |
30-34 | 32 | 6 | 10 | 60 | 600 | 3600 |
35-39 | 37 | 1 | 15 | 15 | 225 | 225 |
Ef = 90 Efd = 170 Efd2 = 11250
Mean = E + d + A
Ef
= -170 + 22
90
= 22 – 1.888 = 20.11
ii) S.d = √Efd – [Efd]2
Ef Ef
= √ 122 – (-1.888)2
= √125 – 3.566 = √121.4
= 11.02
 7.
7.
RQ = 7.5 0.1
< PRQ 40° 1
B1 circle through P, Q and R
d) r = 4.1 ° 0
A = r2
22/7 x 4.1 x 4.1 = 52.83
8.
Class limits | f | cf |
-0.5 – 19.5 | 7 | 7 |
19.5- 39.5 | 21 | 28 |
39.5 – 59.5 | 38 | 66 |
59.5 – 79.5 | 27 | 93 |
79.5 -= 99.5 | 7 | 100 |
i) from the curve – median = 52. M1 A1
(ii) Inter quartile range = 66-38 = 28.
(iii) 7th 7/10 = 62.46marks
(iv) 60th percentile – 56.34
9. 252 + 242 + 222 + 232 + x2 + 262 + 212 + 232 + 222 + 272 = 5154
5.625 +576 + 2(484) + 2(529) + 676 + 441 + 729 + x2 = 5154
X2 = 81
X =9
![]()
(ii) X = 222 = 22.2
![]() 10
10
(X – x)2 = 2.82 + 1.82 + 0.22 + 0.82
![]() 13.22 + 3.82 + 1.22 + 0.82 + 0.22 + 4.82
13.22 + 3.82 + 1.22 + 0.82 + 0.22 + 4.82
(x-x)2 = 7.84 + 3.24 2(0.04) + 2(0.64)
+174.24 + 14.44 + 1.44 + 23.04
= 225.6
10
s.d 22.56
= 4.75
(b) (i) New mean = 22.2 + 3
= 25.2
(ii) s.d = 4.75
10. a) i) x = A + ∑fd
∑f
= 45.6 + (-74)
40
= 43.75
Class | Mis-pt x | d = (x – A) | Frequency f | fd | Fd2 |
1 – 10 11 – 20 21 – 30 31 – 40 41 – 50 51 – 60 61 – 70 71 – 80 81 – 90 91 – 100 | 5.5 15.5 25.5 35.5 45.5 55.5 65.5 75.5 85.5 95.5 | -40.1 -30.1 -20.1 -10.1 -0.1 9.9 19.9 29.9 39.9 49.9 | 1 3 4 7 12 9 2 1 0 1 | -40.1 -90.3 -80.4 -70.7 -1.2 89.1 39.8 29.9 0 49.9 | 1608.01 8154.05 6464.16 4998.49 1.44 7938.81 1584.04 894.01 0 2410.01 |
i) Standard Deviation
![]()
D = e ∑fd2 – ∑fd
![]() ∑f ∑f
∑f ∑f
= 10 34135.11 – -74
40 40
10 x 29.1531 = 29.1531
b) 30th student = 10th from bottom
30.5 + 10 – 8 10
7
= 30.5 + 2.9 = 33.4 marks.
11. a) Mean 45. 5 + 530
60
= 54.33
(b) Median = 50.5 + 30.5 – 23 10
14
= 55.86
![]()
(c) Standard deviation = 2300 – 530
60 60
= 17.52
(d) Modal class 51 – 60
12.
x | f | d | d2 | fd | fd2 |
24.5 | 4 | -30 | 900 | -120 | 3600 |
34.5 | 26 | -20 | 400 | -520 | 10400 |
44.5 | 72 | -10 | 100 | -720 | 7200 |
54.5 | 53 | 0 | 0 | 0 | 0 |
64.5 | 25 | 10 | 100 | 250 | 2500 |
74.5 | 9 | 20 | 400 | 180 | 3600 |
84.5 | 11 | 30 | 900 | 330 | 9900 |
200 | -600 | 37200 |
(a) (i) Mean = A + fd
f
= 54.5 – 600
200
= 51.5
(ii) Standard deviation
= fd2 – fd2
f f
= 37200 – (-3)2
200
= 186 – 9
= 13.30
(b) Q1 = 39.5 + 50 – 30 x 10
72
= 42.28
Q3 = 49.5 + 150-102 x 10
53
= 58.56
Q3 – Q1 = 58.56 – 42.28
= 16.28