Share this:
Population Dynamics
What you need to know and be able to do:
| |
| Describe and suggest reasons for the rapid increase in the world’s population in recent times, ‘the population explosion’. |
| Define the main components influencing population growth – birth rate, death rate and migration. |
| Describe the relationship between population growth and resources and explain why problems may result in some areas such as over-population and under-population. |
| Identify and suggest reasons for contrasting patterns of population growth in different world areas as influenced by differences in birth rate, death rate and migration. Factors affecting these influences should be considered such as differences in social, economic and other factors, e.g. government policies and their impact upon birth rates, differences in health care, social and other factors influencing death rates, especially the impact of HIV/AIDS. These factors should be illustrated by reference to selected examples. |
| Describe the consequences (benefits and problems) of different patterns of population growth. Consideration should be given to variations in the size and nature of dependent populations and standards of living. |
| Identify and suggest reasons for different types of population structure as shown by age/sex pyramids. Candidates should be able to describe population pyramids and relate them to the different stages of the Demographic Transition Model. |
|
Identify the major influences on population density and population distribution. Reference should be made to physical, economic and human factors. |
| Describe and suggest reasons for population migrations. Reference should be made to internal movements such as rural-urban migration as well as to international migrations both voluntary and involuntary. |
|
Be able to use, describe and interpret statistics, graphs, diagrams and maps. |
Global population growth
At present, the world’s population is growing fast – though this has not always been the case.
![]()
Until the 1800s the world’s population grew steadily but slowly for thousands of years.
In 1820 the world’s population reached one billion.
150 years later, in the early 1970s, the world’s population reached three billion.
In 1999, less than 30 years later, the population doubled to six billion.
The global rate of population growth is now very fast (rising by about one billion every 15 years).
Causes and rates of change
The population of any place changes over time. There are three main causes of population change:
![]()
Births – usually measured using the birth rate (number of live births per 1000 of the population).
Deaths – usually measured using the death rate (number of deaths per 1000 of the population) .
Migration – the movement of people in and out of an area.
Rate of change
Births and deaths are natural causes of population change. The difference between the birth rate and the death rate of a country or place is called the natural increase, and you calculate the natural increase by subtracting the death rate per 1000 population from the birth rate per 1000 population:
natural increase = birth rate – death rate
The rate of natural increase or growth rate of a population is given as a percentage, calculated by dividing the natural increase by 10.
For example if the birth rate is 14 per 1000 population, and the death rate is 8 per 1000 population, then growth rate = 14 – 8 = 6
That is 6 / 1000, which is equal to 0.6%.
Overpopulation is when there is not enough resources for the inhabitants in an area. Inevitably this leads to famine, water and electricity shortages, increased unemployment.
Under population is when there is more resources than inhabitants in an area. Surplus in food and water results in wastes. Societal systems such as schools and hospitals will then not have enough demand to run at a sustainable level. So the cost per capita for the service will increase. Additionally, there will be less “working population” this has a negative impact on a countries economy and will lead to an increase in taxation.
Optimum population is when there is enough resources for the number of inhabitants (population demand for goods is equal to the supply)
Population distribution means the pattern of where people live. World population distribution is uneven. Places which are sparsely populated contain few people. Places which are densely populated contain many people. Sparsely populated places tend to be difficult places to live. These are usually places with hostile environments e.g. Antarctica. Places which are densely populated are habitable environments e.g.
Europe.
Patterns of population growth
Rates of population growth vary across the world. Although the world’s total population is rising rapidly, not all countries are experiencing this growth. In the UK, for example, population growth is slowing, while in Germany and Italy the population has started to decline.
MEDCs
have low population-growth rates, with both low death rates and low birth rates. Population will decline if death rate is greater than birth rate.
LEDCs
on the other hand have high population-growth rates. Both birth rates and death rates in LEDC populations tend to be high. As LEDCs develop, however, improving healthcare leads to death rates falling – while birthrates remain high. It is easy to see how this leads to even higher population-growth rates.
Population will increase if death rate is less than birth rate.
In the tables below there are some comparative birth rates, death rates and population-growth rates in selected LEDC and MEDC countries. The figures are per 1000 of the population per year.
MEDCs
Country |
Birth-rates |
Death-rates |
Natural increase |
Population growth-rate (%) |
UK |
11 |
10 |
1 |
0.1 |
Canada |
11 |
7 |
4 |
0.4 |
Bulgaria |
9 |
14 |
-5 |
-0.5 |
LEDCs
Country |
Birth-rates |
Death-rates |
Natural increase |
Population growth-rate (%) |
South Africa |
25 |
15 |
10 |
1 |
Botswana |
31 |
22 |
9 |
0.9 |
Zimbabwe |
29 |
20 |
9 |
0.9 |
Have a look at the birth and death rates for Bulgaria. The birth rate is 9/1000 and death rate is 14/1000. The birth rate is less than the death rate, which gives Bulgaria a declining population.
Now look at the figures for South Africa. The birth rate is 25/1000 and death rate is 15/1000. South Africa has an increasing population with a population-growth rate of 1%.
The demographic transition model
The
demographic
transition
model
shows population change over time. The model studies how birth rate and death rate affect the total population of a country. It is divided into five stages:
![]() Stage one – the total population is low but it is
Stage one – the total population is low but it is
balanced
due to high birth rates and high death rates.
![]() Stage two – the total population is starting to rise as death rates start to fall due to improvements in health care and sanitation but birth rates remain quite high.
Stage two – the total population is starting to rise as death rates start to fall due to improvements in health care and sanitation but birth rates remain quite high.
![]() Stage three – the total population is still rising rapidly, but the gap between birth and death rates narrows due to fewer children needed to work in farming and the availability of contraception. Now the
Stage three – the total population is still rising rapidly, but the gap between birth and death rates narrows due to fewer children needed to work in farming and the availability of contraception. Now the
natural increase
is
high.
![]()
Stage four – the total population is high, but it is balanced due to a low birth rate and a low death rate. Birth control is widely available and there is a desire for smaller families.
![]()
Stage five – The total population is high but going into decline due to an ageing population and a continued desire for smaller families, with people opting to delay having children until later in life.
As a country passes through the demographic transition model, the total population rises. Most
LEDCs
are at stage 2 or 3 (with a growing population and a high natural increase). Most
MEDCs
are now at stage four of the model and some such as Germany and Italy have entered stage 5.

Notice how as we move through the stages of the model, the gap between birth rate and death rate first widens, then narrows. In stage 1 the two rates are balanced. In stage 2 they
diverge,
as the death rate falls relative to the birth rate. In stage 3 they
converge
again, as the birth rate falls relative to the death rate. Finally in stage 4 the death and birth rates are balanced again – but at a much lower level.
Limitations of the model
The demographic transition model has two limitations:
- The model was developed after studying the experiences of countries in Western Europe and North America. Conditions might be different for LEDCs in different parts of the world.
- The original model doesn’t take into account the fact that some countries now have a declining population and a fifth stage. Most texts will now show this stage as it is relevant to an increasing number of MEDCs in the 21st century.
Population can also be affected by disease and governmental policies.
The affect of Aids/HIV in Botswana
Botswana has been hard hit by
AIDS.
In 2007 there were an estimated 300,000 people living with
HIV – almost one-in-four adults. Considering Botswana’s population is below two million, the epidemic has reached disturbing proportions. The country has an estimated adult HIV prevalence of 23.9%, the second highest in the world after Swaziland.
 HIV and AIDS has had a devastating impact on Botswana. Life expectancy at birth fell from 65 years in 1990-1995 to less than 40 years in 2000-2005, a figure about 28 years lower than it would have been without AIDS. The loss of adults in their productive years has serious economic implications, with families being pushed into poverty through the costs of HIV and AIDS medical care, loss of income, and funerals. The economic output of Botswana has been reduced by the loss of workers and skills; agriculture and mining are among the worst affected sectors.
The loss of adults to AIDS has also had a significant effect on children in Botswana: an estimated 95,000 children have lost at least one parent to the epidemic. It is vital these children have access to education, but this is problematic in families already weakened by AIDS where children may be providing care for ill relatives or supporting siblings.
In an address to the UN assembly in June 2001, President Festus Mogae summed up the situation by saying:
“We are threatened with extinction. People are dying in chillingly high numbers. It is a crisis of the first magnitude.”
In response to this emergency, Botswana became the first African country to aim to provide
antiretroviral
drugs
to
all its needy citizens. The success of this treatment programme has made Botswana an example for other African nations to follow. Yet even with
universal treatment
access,
the country continues to suffer greatly from AIDS. If it is ever to defeat the epidemic, Botswana must find a way to halt the spread of HIV.
The birth of MASA (new dawn)
By January 2002, the aim was to provide medication during the coming year to 19,000 of the 110,000 infected people whom it was considered could benefit.
These included,
![]() Infected people in the capital – Gaborone
Infected people in the capital – Gaborone
Babies
Pregnant women
HIV prevention in Botswana
There are a number of different types of HIV prevention programme taking place in Botswana. These include:
![]()
Public education & awareness
AIDS education
for
young
people
Condom distribution & education
Targeting of high risk adult populations
Improvement of blood safety
Prevention of mother-to-child transmission of HIV
Challenges faced during treatment scale-up
By June 2002, an estimated 1,000 people had been enrolled in MASA.
Of these, 500 were on therapy, while the remainder were having their requirements assessed. Although the numbers were disappointingly small, the indications were that few people were having difficulty following the regime. There had been a major concern that poorly educated people would struggle to understand the importance of taking the complex cocktail of drugs on time for the rest of their lives. To help people with adherence, NACA came up with a “buddy system” whereby each patient is encouraged to form a special bond with someone close to them, who makes sure that they follow their medication schedule. The patients in turn counsel others to come forward for testing and treatment.
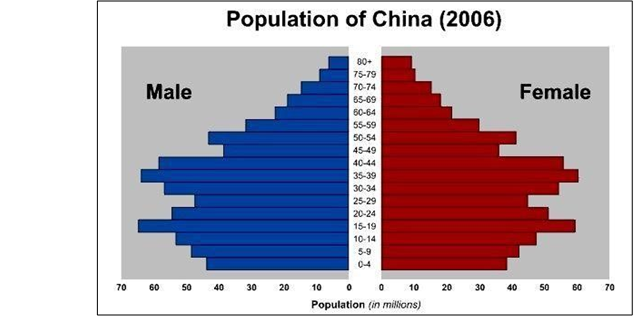
The affect of the one child policy in China
China has proclaimed that it will continue its one child policy, which limits couples to having one child, through the 2006-2010 five year planning period.
China’s one child policy was established by Chinese leader Deng Xiaoping in 1979 to limit communist China’s population growth. Although designated a “temporary measure,” it continues a quarter-century after its establishment. The policy limits couples to one child. Fines, pressures to abort a pregnancy, and even forced sterilisation accompanied second or subsequent pregnancies.
It is not an all-encompassing rule because it has always been restricted to ethnic Han Chinese living in urban areas. Citizens living in rural areas and minorities living in China are not subject to the law. However, the rule has been estimated to have reduced population growth in the country of 1.3 billion by as much as 300 million people over its first twenty years.
This rule has caused a disdain for female infants; abortion, neglect, abandonment, and even infanticide have been known to occur to female infants. The result of such Draconian family planning has resulted in the disparate ratio of 114 males for every 100 females among babies from birth through children four years of age. Normally, 105 males are naturally born for every 100 females.
Recent Effects of the One Child Law
Now that millions of sibling-less people in China are now young adults in or nearing their child-bearing years, a special provision allows millions of couples to have two children legally. If a couple is composed of two people without siblings, then they may have two children of their own, thus preventing too dramatic of a population decrease.
Although IUDs, sterilisation, and abortion (legal in China) are China’s most popular forms of birth control, over the past few years, China has provided more education and support for alternative birth control methods.
Statistically, China’s
total
fertility
rate
(the number of births per woman) is 1.7, much higher than slowly- declining Germany at 1.4 but lower than the U.S. at 2.1 (2.1 births per woman is the replacement level of fertility, representing a stable population, exclusive of migration).
In 2007, there were
reports
that in the southwestern Guangxi Autonomous Region of China, officials were forcing pregnant women without permission to give birth to have abortions and levying steep fines on families violating the law. As a result, riots broke out and some may have been killed, including population control officials.
The Future of China’s One Child Law
China’s eleventh Five-Year Plan Period is from 2006 to 2010. Minister of the State Commission of Population and Family Planning Zhang Weiqing confirmed in early 2006 that China’s one child policy is consistent with the nation’s plan for population growth and would continue indefinitely. He denied rumors that the policy become less stringent to permit a second child.
The Population distribution of the world

People are unevenly distributed around the world. The difference in distribution is measured by comparing population density – that is, the number of people per square kilometre (km²).
Population density is determined less by economic development than by environmental factors, which make an area more or less attractive to settlers.
The way in which people are spread across a given area is known as population distribution. Geographers study population distribution patterns at different scales: local, regional, national, and global.
Patterns of population distribution tend to be uneven. For example, in Italy there are more people living in the north than the south.
Population density
Population density is the average number of people per square kilometre. It is a way of measuring population distribution. It shows whether an area is sparsely or densely populated. Population density is calculated using the following formula:
Population density = total population divided by total land area in km²
Factors Affecting Population Density
There are a range of human and natural factors that affect population density. The tables below illustrate this.
Physical Factors | High Density | Low Density |
Relief (shape and height of land) | Low land which is flat e.g. Ganges Valley in India | High land that is mountainous e.g. Himalayas |
Resources | Areas rich in resources (e.g. coal, oil, wood, fishing etc.) tend to densely populated e.g. Western Europe | Areas with few resources tend to be sparsely populated e.g. The Sahel |
Climate | Areas with temperate climates tend to be densely populated as there is enough rain and heat to grow crops e.g. UK |
Areas with extreme climates of
hot and cold tend to be sparsely
populated e.g. the Sahara Desert |
Human Factors | High Density | Low Density |
Political | Countries with stable governments tend to have a high population density e.g. Singapore | Unstable countries tend to have lower population densities as people migrate e.g. Afghanistan. |
Social | Groups of people want to live close to each other for security e.g. USA | Other groups of people prefer to be isolated e.g. Scandinavians |
Economic | Good job opportunities encourage high population densities, particularly in large cities in MEDCs and LEDCs around the world. |
Limited job opportunities cause
some areas to be sparsely
populated e.g. Amazon Rainforest |
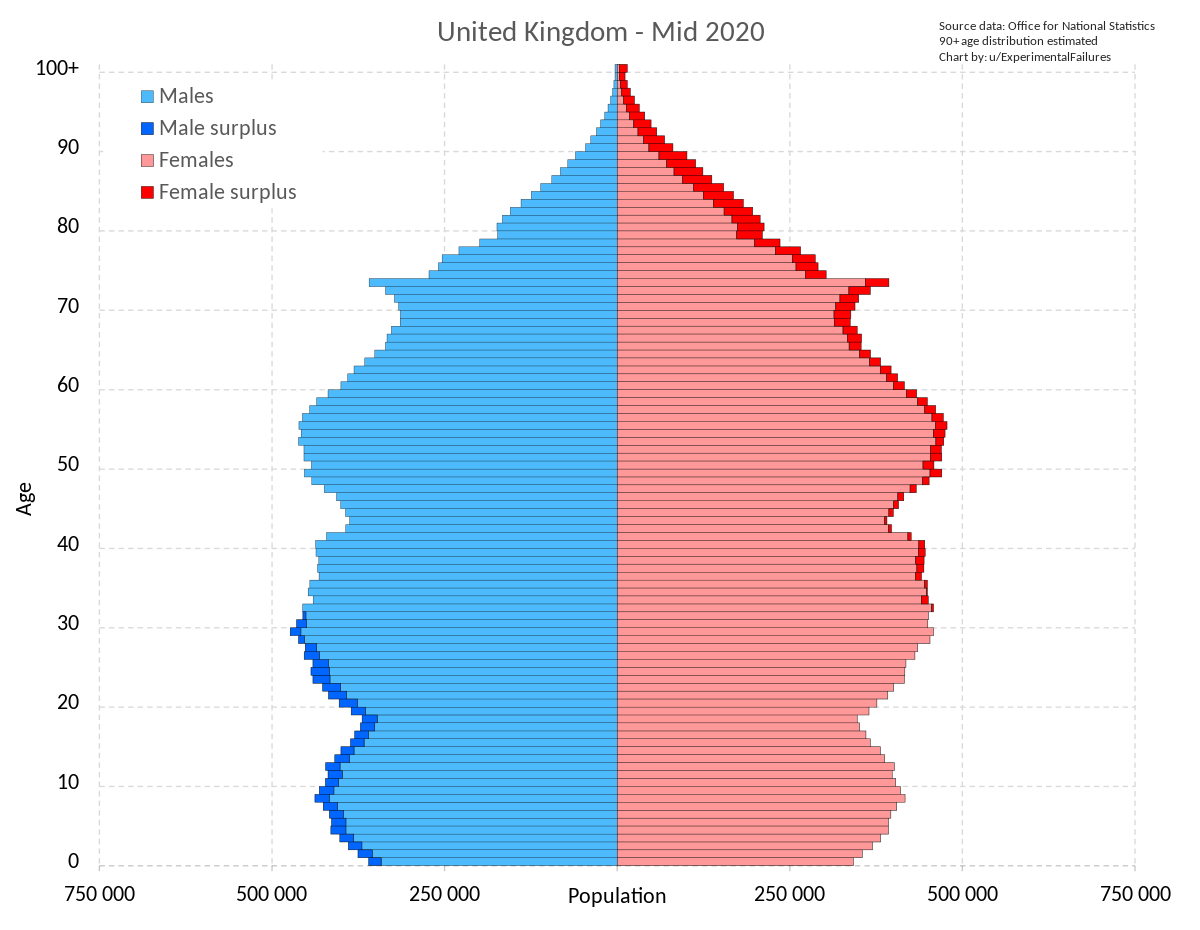
![]() Looking at the population structure of a place shows how the population is divided up between males and females different age groups.
Looking at the population structure of a place shows how the population is divided up between males and females different age groups.
Population structure is usually shown using a population pyramid. A population pyramid can be drawn up for a whole country or an individual town, city or village.
This graph shows the population pyramid for the a MEDC (the UK.)
The left side of the pyramid shows the number of men in each age group, the right side shows the number of women in each age group.
Notice how in the UK 2000 pyramid there is a noticeable bulge in the area of the 30-34 and 35-39 age groups, with the numbers thereafter reducing fairly steadily as the ages increase. This matches stage 4 of the demographic transition model.
Population pyramid for the UK 2000

Compare this to the 2025 pyramid, which would be stage 5 in the model. Here the bulge extends much further, covering the age groups 30-34, 35-39, 40-44, 45-49, 50-54, 55-59 and 60-64, with the numbers beginning to reduce significantly only after 64.
Now compare the UK population pyramids with those for Mozambique:
In this graph, notice that in 2000 the 0-4 age group contained the largest number of people, with the numbers thereafter declining steadily as the ages increase.
The graph looks like a triangle or pyramid and matches stage 1 in the model.
 Projected population pyramid for the UK 2025

Population pyramid for Mozambique 2000
Projected population pyramid for Mozambique 2025

In this graph, the largest group in Mozambique in 2025 is still the 0-4 age group, but there are nearly as many people in the 5-9, 10-14, 15-
19, 20-24 and 25-29 age groups.
Now the population pyramid looks less like a triangle or pyramid and is more like stage 2.
Key things to know about population pyramids:
![]() The shape of a population pyramid is very important and can tell us a lot about the people living in a particular country or place.
The shape of a population pyramid is very important and can tell us a lot about the people living in a particular country or place.
![]()
The shape of a population pyramid gives us information about birth and death rates as well as life expectancy.
![]() A population pyramid tells us how many
A population pyramid tells us how many
dependants
there
are living in an area. There are two groups of dependants; young dependants (aged below 15) and elderly dependants (aged over 65).
![]() Those of working age are classed as economically active. Dependants rely upon the
Those of working age are classed as economically active. Dependants rely upon the
economically
active
for economic support.
![]() Many LEDCs have a high number of young dependants, whilst many MEDCs have a growing number of elderly dependants.
Many LEDCs have a high number of young dependants, whilst many MEDCs have a growing number of elderly dependants.
How may a pyramid change over time?
![]() A population pyramid that is very triangular (eg Mozambique in 2000) illustrates a population with a high number of young dependants and a low life expectancy.
A population pyramid that is very triangular (eg Mozambique in 2000) illustrates a population with a high number of young dependants and a low life expectancy.
![]() A population pyramid that has fairly straight sides (more like a barrel) illustrates a population with a falling birth rate and a rising life expectancy.
A population pyramid that has fairly straight sides (more like a barrel) illustrates a population with a falling birth rate and a rising life expectancy.
![]() Over time, as a country develops, the shape of its population pyramid changes from a triangular shape to a barrel-like shape with straighter edges.
Over time, as a country develops, the shape of its population pyramid changes from a triangular shape to a barrel-like shape with straighter edges.
![]() Places that are experiencing an ageing population and a very low birth rate may have a population structure that looks a little like an upside-down pyramid.
Places that are experiencing an ageing population and a very low birth rate may have a population structure that looks a little like an upside-down pyramid.
Migration
As the dynamics of a country changes as do the living conditions and quality of life. Similarly, economics and politics also have a massive contribution to the standards of living in any particular country. The movement of people from one place to another over time is called migration. This can happen within a country, internal migration or between countries, international migration. Connected to this are the reasons for the move in the first place. Some migrations happen through a conscious decision to move to improve the standard of living, voluntary migration. In contrast, forced migration, tends to occur after large natural disasters or conflict.
Nevertheless all types of migration involve push and pull factors. These are simply reasons that people move from an area, push factors and why people move to a particular area, pull factors. Pull factors often give stability or security whilst push factors contribute to instability or insecurity. Every country has pull factors and push factors.
Complete the table below using your own notes.
Push Factors | Pull Factors |
Lack of employment opportunities (perhaps due to overpopulation or recession) | Availability of jobs in many sectors. |
Famine, Drought or other natural disasters | Stable and favourable climate. Low rish of natural disasters. |
Lack of food |
|
Poor housing |
|
| Many trained doctors and nurses provide a reliable health care system. |
Poor education facilities |
|
|
|
More often than not, the conditions that migrants live in after they have moved are not as they had expected them to be. Sometimes there are bureaucratic problems in getting work due to visas, language barriers, racial tensions, lack of housing facilities and so on.


